Download
1 / 19
190 likes | 338 Views
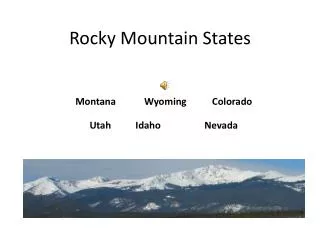
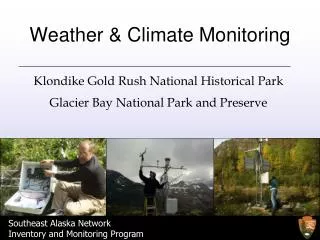
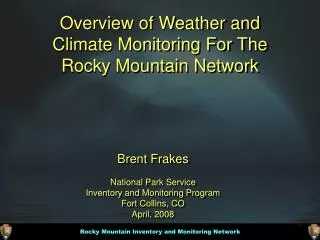
Overview of Weather and Climate Monitoring For The Rocky Mountain Network. Brent Frakes National Park Service Inventory and Monitoring Program Fort Collins, CO April, 2008. Presentation Overview. Objectives Variables Datasets Example Report Integration with NPClime. Monitoring Objectives.

E N D
Overview of Weather and Climate Monitoring For The Rocky Mountain Network Brent FrakesNational Park ServiceInventory and Monitoring ProgramFort Collins, COApril, 2008
Presentation Overview • Objectives • Variables • Datasets • Example Report • Integration with NPClime
Monitoring Objectives • Monitor climate at numerous spatial and temporal scales • Help interpret/explain observations from other protocols • Determine influence of climate on Vital Signs • Remove climate signal to minimize variance • Provide useful and simple park metrics for application to management decisions • Fire Risk • Drought • Vegetation growth • Consider both drivers and effects of climate variability and change • Sustainable over long term • Cost-effective • Repeatable
Scales of Atmospheric Process • Positive relationship between space and time • Small-scale processes embedded within larger-scale process • Surface environment responds to various processes
Monitoring Variables • Temperature • TMIN, TMAX, TAVG • Frost free days • Precipitation • Accumulated • Maximum • Snow • Snow Water Equivalent • Extent • Drought • Palmer Drought Severity Index (PDSI) • Surface Water Supply Index (SWSI) • Palmer Meteorological Drought Index (PMDI) • Modes of climate variability • Atmosphere – North Atlantic Oscillation (NAO), Pacific North American Pattern (PNA) • Oceans – Pacific Multi-decadal Oscillation (PDO), El Nino Southern Oscillation (SOI)
Data Sources • Station-Level Summaries • SNODAS • PRISM • Climate Division Drought Indices • Atmospheric/Oceanic Indices
Representing Scales SPACE/TIME CONTINUUM Monthly Northern hemisphere Atmosphere/Ocean Index Monthly Climate Region Drought Monthly 1 to 4-km grid SWE, PPT,TAVG Daily Weather Index* Park PPT,TMAX,TMIN,TAVG Daily Weather Observations Point PPT,TMAX,TMIN,TAVG NPClime
Daily Station-Level Summaries • Mandatory and useful • Represent point observation • Capture microclimatic effects • Ground truth • TMAX, TMIN, TAVG, PPT, SWE • NSW COOP, SNOTEL, SnowCourse
Daily Park Index • Representative of entire park or meaningful units (from point to polygon…) • Derived from relevant weather stations • Weighted by proximity to park • Account for elevation • Value • Remove local effects and station errors • One dataset vs. many 30-yr TMEAN for West Slope of ROMO
Monthly PRISM Data • Precipitation-elevation Regressions on Independent Slopes Model • 4-km resolution • 1895-present • PPT, TMIN, TMAX, Dewpoint
Monthly SNODAS Data • 1-km resolution • Daily • 2003-present • Variables • Snow Depth • Snow Water Equivalent • Extent • Remotely sensed, ground observations and model
Climate Division Drought Indices • Monthly • 1895 – present • Multiple drought indices to capture meteorological and hydrological drought
Bringing the Data Together Snow -2006 • SWE – Snow Water Equivalent
Current Development • SOPs for Data Collection and Processing • Python Climate Modules • Stations (and other tabular) • Read (SNOTEL, Snowcourse, climate division drought indices, other) • Write to a standard format
To there… • 9 standard output fields
Grid Module • Read PRISM and SNODAS • Unzip • Untar/Untar/Untar…. • Read and clip bils • Average of Many Grids • Grid Percentile • Compare one grid to a climatology of others • Multi-grid Zonal Stats • Drill polygon(s) through multiple grids
Integration With NPClime • Web Interface • Stations module can read other data sources not part of NPClime (e.g., SnowCourse, SNOTEL, Climate Division Drought Indices) • Standard methods for writing data • Stand-alone Module • Enhanced functionality not possible with web • Especially with gridded datasets • Open source and will improve as needed