PRODUCT POSITIONING
PRODUCT POSITIONING. 15.823 Internet Marketing Prof. Glen L. Urban Spring 2001. Understanding Customers Consumer Behavior B2C vs B2B. Strategy Formulation Trust vs. Push Product Design Segmentation Positioning. Customer Acquisition Advertising / PR/Selling Pricing & Promotion.

PRODUCT POSITIONING
E N D
Presentation Transcript
PRODUCT POSITIONING 15.823 Internet Marketing Prof. Glen L. Urban Spring 2001
Understanding Customers Consumer Behavior B2C vs B2B Strategy Formulation Trust vs. Push Product Design Segmentation Positioning Customer Acquisition Advertising / PR/Selling Pricing & Promotion Distribution Channel Logistics Relationship Building Fulfillment Service
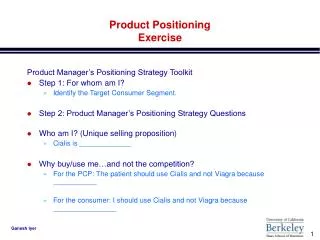
OUTLINE • Positioning Versus Segmentation • Positioning Example • Analytic support for Mapping • Does it Pay to be First? -- Order of Entry Theory • Implications for Internet
A E A • • • • • B C • • D • B
POSITIONING GIVEN SEGMENTATION CBP DIMENSIONS COORDINATES FULFILLMENT UNIQUE POSITION SHARE/PROFIT
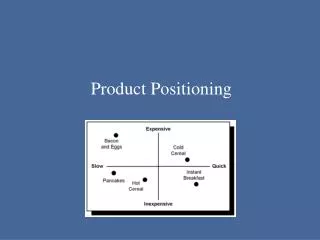
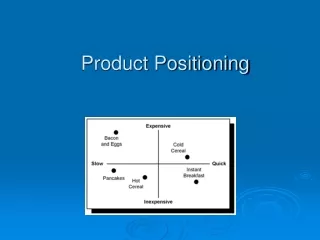
MAPPING STEPS Define category/segment Identify products that compete Attributes and features that differentiate Group attributes - perceptual dimensions Draw map Implications
CLASS EXAMPLE • On Line Trading • evoke -- dimensions --triad comparisions • judgement for position • preference vectors • implications
POSITIONING ANALYSIS LEVEL I focus group customer contact inspect competition perceptual map -- judgment LEVEL II factor analysis preference vectors conjoint analysis LEVEL III simulation models
MAPPING INPUTS Durability/resale performance MPG reliable Luxury style safe maintain quality 6 6 5 6 5 5 5 7 6 5 7 5 4 4 4 5 6 4 3 6 4 4 7 5 3 5 3 BILL -- M.B. 500 BILL -- HONDA BILL -- BUICK ELECTRA
DATA COLLECTION • Email lists • Zoomerang • On Line Panels • NFO • Burke • Greenfield
FACTOR LOADINGS Dimensions Attribute Luxury 0.88 0.10 Style 0.72 0.08 Reliable 0.45 0.63 M.P.G. 0.24 0.64 Safe 0.52 0.31 Maintain 0.10 0.67 Quality 0.48 0.64 Durability & Resale 0.38 0.60 Performance 0.67 0.35
Honda Rational • Olds • Lincoln Town Car • Buick Riviera • Chrysler New Yorker • Cadillac Eldorado Emotional
Honda Rational • MB • BMW • Olds • Lincoln Town Car • Buick Riviera • Jaguar • Chrysler New Yorker • Cadillac Eldorado Emotional
Honda Rational • MB • BMW • Olds • Lincoln Town Car • Buick Riviera • Jaguar • Chrysler New Yorker • Cadillac Eldorado Emotional
PERCEPTION ENGINEERING FEATURES PREFERENCE
Buyer Centric Idea Base Trust for Customer Construct business model of eCRM. Construct new services and products of eBusiness. Construct secure business with internet customers. Aim of eBusiness@Suruga Keyword for Success What shall Suruga do?
INTERNET STUDY? • Talk to Customers -- Listen • Study Competitors -- judgmental Map • Focus Groups • Budget study if VC -- Crowded Out There • Active Role in Study
STEPS BUDGET DEFINE TARGET MARKET DESIGN SURVEY ATTRIBUTE GENERATION STATISTICAL MAPPING Name Dimensions Number of Dimensions Coordinates of Brands Importance Vectors MANAGER’S ROLE $50k to $250K Be Sure Correct Segment Definition is Used Specify Decision Requirements Assure Completeness Input Judgment Examine Additional Dimension for Relevance Review for Reasonableness Decide on Number of Sub-group Internet Study
STEPS FEATURES SIMULATE IMPROVED POSITIONING MANAGER’S ROLE Select Features and Levels, Link to preference and/or Perception Be Sure Shift Can Be Achieved, Confirm with Concept/Product Tests Internet Study - Cont’d
THEORY • Determinants -- +/- • Memory -- Accessibility • Switching costs - risk and satisfaction • Learning about Market • Market Power - Share & Channel • Scale -- Production and Funds • Continuing Innovation • Standard Setting • Broader Product Line • Technology/Market window • Best Positioning? • Empirical
ORDER OF ENTRY AND MARKET SHARE IN CONSUMER GOODS BUSINESS Average Market Share Pioneer 29 Early Follower 17 Late Entrant 12 (371 SBU’s) Frequency Distribution for Market Share Less than 10 10-19 20-29 30 & up Total Pioneer 16% 20% 23% 41% 100% Early Follower 41% 24% 19% 16% 100% Late Entrant 56% 25% 12% 7% 100%
DATA 131 Brands 36 Categories Share - Last Purchases Order Advertising Preference
ORDER OF ENTRY 1ST 2ND 3RD 4TH 5TH 6TH 7TH 100 57 43 42 32 26 34 26 22 18 29 22 18 16 15 25 19 16 15 13 12 23 17 15 13 12 11 9 Market Share
Strategic Implications Market Share Reward for Innovation If First: Position Well-Preempt Support - Advertising & Promotion If Second or Third: Premium Position Support - Advertising & Promotion Faster But Lower Innovate for Market Leadership -- But Risk
IMPLICATIONS FOR INTERNET • Mapping -- Do It! • Listen /Focus Groups • Budget for Study in VC • Segmentation and Positioning Strategy vs. Potential Competition -- Preempt • Core Benefit Proposition -- Not Technology • Establish with Features and Keep Innovating • First In has Value • But Catch window • Have Best Position • Spend behind It