Download

1 / 34
340 likes | 530 Views
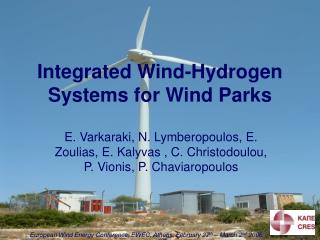
Small-Scale Wind for Hydrogen Production for Rural Power Supplies: HyLink System at Totara Valley. MUCER Energy Postgraduate Conference Wellington 3-5 June 2008

E N D
Small-Scale Wind for Hydrogen Production for Rural Power Supplies:HyLink System at Totara Valley MUCER Energy Postgraduate Conference Wellington 3-5 June 2008 presented by Peter Sudol (Massey University)
Totara Valley • Demonstration site for Massey University and Industrial Research Limited on distributed generation Aims: - design a renewable hybrid micro-power system at the end of 11 kV distribution line - provide network support
HyLink System Demonstration on hydrogen as a means of balancing and transporting the fluctuating wind powerSystem implementationby IRLSystem analysis by Massey UniversityMassey University’s 2.2 kWwind turbine incl. control system will be used in conjunction with a larger electrolyser currently being developed at IRL.
Hylink in the IRL Laboratory Hydrogen was stored in 150m MDPE pipeline located in a container filled with sand, outside of the lab. Electrolysis setup
Alkaline Fuel Cell DCI 1200 Setup The electricity produced was used to charge batteries or was inverted to the grid. Source: IRL
Electrolyser Stack Connection positive electrical potential hydrogen pressure meter water and oxygen outlet hydrogen outlet negative electrical potential water inlet Distilled water is pumped just through the anode compartment (oxygen side) of the electrochemical cells which is not pressurised.
Lynntech Electrolyser Stack catalysed membrane metal flow field Source: Lynntech Industries active area of 33 cm2 The right stainless steel endplate (+ electronics) was used for a previous application and was replaced by a titanium endplate.
Electrolyser Stack - VI Curves At higher stack temperature there is a higher electr. current flow (higher hydrogen production) at the same voltage due to improved reaction kinetics.
System Efficiency Estimation • Electrolyser: η= 65.3% electricity (+heat)/hydrogen conversion efficiency (at a current flow of 23,5 A) - Not considered: hydrogen pressure energy output, power consumption of the 12W water pump, heat transfer with circulating water • Alk. FC DCI 1200: η = 41.1% hydrogen/electricity conversion efficiency • (at 650 W electrical power output) • - Not considered: thermal energy output (approximately 20% combined heat • and power efficiency over 60%) The above efficiencies were calculated using the lower heating value (LHV) of hydrogen. Hydrogen production/consumption was estimated by measuring the pressure increase/drop in the pipe.
Proven Wind Turbine • Rated power output: 2.2 kW • Zebedee furl (+ cone) system • allows for dynamic balance • between the rpm and the pitch • of the airfoil. • During stormy winds turbine • doesn’t stop, instead, keeps • generat. at nearly rated power. Drawing: Proven Energy Limited
Air-X 400 W
Wind Power Control and Electrolysis Container 3 x 48 W solar panels for additional battery charging Distilled water tank for the electrolysis Hydrogen pipeline - the top riser
Electrolyser in the Container Flash arrestor Recombiner Deionisation column Electrolyser stack Dehydration unit Circulating water reservoir Water pump Source: IRL
Hylink Transition to Totara Valley Pipeline mole ploughing (60 cm deep) Electrofusion joint between the pipeline sections MDPE Internal diameter: 16 mm Outer diameter: 21 mm Wall thickness: 2.5 mm Length: 2 km Volume: 402 L Welder for electrofusion Source: IRL
Fuel Cell Connection in the Woolshed Pressure sensor PEM fuel cell ReliOn Independence 1000 (J48C) IRL controller IRL grid-connected inverter 48 V gel battery bank The batteries power the control and data logging equipment as well as provide a necessary buffer for the fuel cell and inverter. Operating PEMFC supplies the inverter and the controller as well as charges the batteries. Source: IRL
Hydrogen Diffusion Rate Estimation The pipeline was pressurised with 4.1 barg hydrogen and then the pressure drop was recorded. Result: Hydrogen loss: 42.5 kPa/week 7.5mol/week 15 g/week 0.5 kWh/week at LHV 3 W Currently, the fuel cell operates at pipeline pressure between 1 barg and 2 barg, so at average 2.5 bar abs. Using: 1.5 Wmeanpower loss due to H2 diffusion through pipe walls during fuel cell operation
Hydrogen Permeability through PE - Comparison Industry (at 23°C): Massey University (at 20°C) : Totara Valley (at 10°C): General rule of thumb for Arrhenius equation: for every 10°C increase the reaction rate doubles. Or EP and P0 can be estimated by measuring P at different T and solving:
Frictional Pressure Drop Estimation at Fuel Cell’s max. Output • According to the manufacturer, the fuel cell consumes at 1 kW 15 stdL H2 /min mean H2 velocity is 1.24 m/s • Due to the gas flow is laminar, and hence, the friction factor f independent of roughness . • Then the frictional pressure drop can be calculated using the Darcy-Weisbach equation as follows: • Considering that the fuel cell requires low H2 pressure for operation, the calculated pressure drop can be neglected.
HOMER Simulation of the current HyLink System Configuration Selected Results
Data Inputs • Batteries’ task is not to store energy to meet community’s load requirements. They cover the system internal electricity needs, and PV panels can be thought as the power source for that. For this reason batteries as well as PV panels were excluded from the simulation. • Wind resource data was taken from the NASA website, however the four wind parameters (Weibull shape factor etc.) derive from the previous study at Massey University. • The average of one of the eight monitored sites at Totara Valley was used as the primary load data. • Furthermore, factual and not projected data was used e.g. for the ReliOn fuel cell the lifetime of 4,000 operational hours and not 40,000 operational hours.
HyLink System Schematics used in HOMER grid-connected stand-alone
Providing Back-up Power for Peak Loads (May) - Grid purchase capacity constrained at 2.3 kW - max. hourly peak load throughout a year: 3.3 kW - 1 kW fuel cell
Providing Back-up Power for Peak Loads (July) - Grid purchase capacity constrained at 2.3 kW - max. hourly peak load throughout a year: 3.3 kW - 1 kW fuel cell
Providing Back-up Power for Peak Loads Due to small system configuration, esp. wind turbine/electrolyser, very dependent on the prevailing wind conditions.
Daily Pipeline Filling Process Fluctuations due to changing Wind
Scenario for HyLink with added Massey University’s 2.2 kW Wind Turbine and IRL’s 1 kW Electrolyser The previous capacity shortage on 24th July is compensated due to improved system response.
Scenario for HyLink with added Massey University’s 2.2 kW Wind Turbine and IRL’s 1 kW Electrolyser
Scenario for HyLink with added Massey University’s 2.2 kW Wind Turbine and IRL’s 1 kW Electrolyser
Outcomes • Low durability and high replacement cost of electrochemical conversion devices represent the main barrier in introducing the HyLink system • Small-sized system very dependent on the prevailing wind conditions – low energy buffer capability • The 36%-efficient fuel cell/inverter subsystem consumes the full pipe content (3.3kWh at 3bar pressure difference) in ca. 1 hr at 1kW ac output. • The wind turbine/electrolyser subsystem needs ~9hrs at its rated power (80 stdL/hr, 360 W) to provide this hydrogen content – at optimal wind conditions • Hence, the fuel cell/inverter efficiency (36% electr.) constrains the overall system performance and the small wind turbine/electrolyser size slows the system’s response.
General Outcome • Successful demonstration of a new energy concept – in operation since May 2008 • The HyLink system reveals barriers and opportunities of hydrogen based energy systems. • The HyLink system proves, that an energy carrier can be produced from a renewable resource high efficiently. • The HyLink system proves that this energy carrier can be transported via cheap pipelines. • The HyLink system proves that this energy carrier can be converted to electricity high efficiently (not Carnot Cycle constrained), carbon neutral and noiseless in fuel cells.
Acknowledgements • Prof. Ralph Sims (Massey University) • Attilio Pigneri (Massey University) • Steve Broome (IRL) • Edward Pilbrow and Eoin McPherson (IRL) • Jim Hargreaves (Massey University), Phil Murray, Mark Carter • Totara Valley residents • and many others at Massey