Download
1 / 17
170 likes | 421 Views
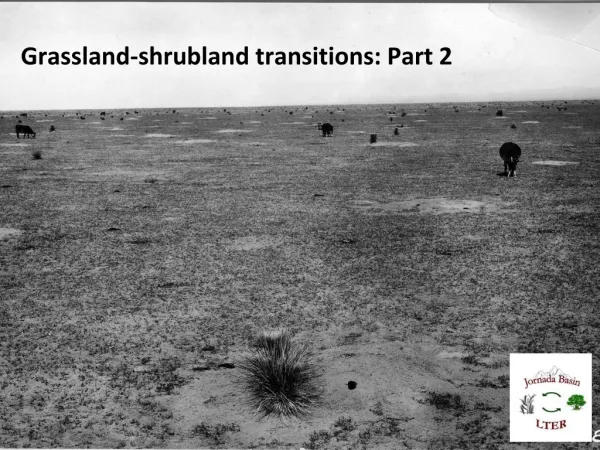
Grassland-shrubland transitions: Part 2. Schlesinger et al. (1990) “islands of fertility” or “ Jornada ” desertification model. Feedback. Feedback. Disruption of perennial grass cover, shrubs invade. Lateral flux of water, sediment, nutrients Percolation.

E N D
Schlesinger et al. (1990) “islands of fertility” or “Jornada” desertification model Feedback Feedback Disruption of perennial grass cover, shrubs invade Lateral flux of water, sediment, nutrients Percolation Not clear how perennial grasses are lost from the ecosystem— a focus of long-term work since LTER IV
How does connectivity impact transport vectors (wind and water) and the distribution of nutrients to impact state change? The "Scraped Site" (1991) Water flow at state boundaries Okin et al 2001 Okin et al 2006 Mueller et al 2007
Do grasslands cross critical thresholds at low, but positive, levels of grass cover? Driver-control model: grass driven extinct directly by grazing/drought • Grass cover/production • Feedback-control model: critical threshold of grass cover below • which soil erosion/hydrological • feedbacks drive remaining grass cover extinct • Driver • Bestelmeyer et al, 2013, Ecology Letters
Do changes in connectivity cause desertification? Okin et al. 2009
Aeolian Transport – Sand Sheet and Gap Size Okin et al 2006
Experimental evaluation of threshold models • with respect to aeolian transport • Hypothesis 1(b) As bare gap sizes increase, a connectivity threshold level is reached that sets the stage for nonlinear increases in the spatial extent of shrub dominance owing to negative effects on grass persistence [Hypothesis 1(a)] and positive feedbacks to shrub establishment and growth. • Split-treatment (Upwind-Downwind) experiment begun in 2004 • 3 Blocks with4 (split) treatments and 1 control in each
Specific expectations Vegetation cover will make horizontal flux increase both upwind and downwind Enhanced flux will impact soils upwind and downwind and vegetation downwind Thresholds will exist where system becomes "lossy" and state change occurs downwind.
Horizontal Flux • Horizontal flux does not scale monotonically with vegetation cover in all years. • It's becoming increasingly common to see lower flux at the 100% removal site where cover ~6% • Incidentally, these data have also been useful in calibrating a connectivity-based horizontal transport model
Upwind treatment at 100% removal has eroded to the less-erodible B horizon • Horizontal Flux No decrease post-2007 This indicates a severe disturbance may be self-limiting, whereas a more moderate disturbance may have a comparable effect in the long term With time, the flux on the treatment downwind of the 100% removal has reached the level of the the removal treatment itself
How does enhanced flux influence vegetation? With time, the flux on the treatment downwind of the 100% removal has reached the level of the the removal treatment itself • Potential mechanisms: Burial/Dynamic Surface? Abrasion? Nutrients?
Burial or Dynamic Surface? Upwind Downwind Upwind Downwind
Nutrients Li et al. 2007 Threshold? Resampled Summer, 2013
Conclusions at thispoint • Aeolian processes have an important impact on vegetation and nutrients on both directly and indirectly impacted sites • Evolution of the soil over the long term adds an unexpected wrinkle • We see nonlinear decreases in grass persistence [1(a)] which supports existence of a feedback favoring shrubs due to increased (downwind) aeolian transport • Mechanisms are uncertain (pending full proposal) Ongoing/FutureWork • Analyze soil data for SOC & TN (changes in thresholds? changes in spatial distribution of nutrients?) • UAV-derived aerial photo analysis of vegetation cover and connectivity (better quantify grass + shrub cover/distribution)
LTER VI Proposal, Hypothesis 1(c):Vegetation and resource losses propagate to initiate state change dynamics in downwind /downslope locations. Connectivity-based feedback (from Okin et al. 2009) • Design of this experiment has been difficult: • Replication vs. size • Wind and/or water? • Connectivity or pattern?
LTER VI Proposal, Hypothesis 1(c):Vegetation and resource losses propagate to initiate state change dynamics in downwind /downslope locations. • The plan is to conduct modeling experiments with ECOTONE-WEMO and other connectivity-based models (e.g., Stewart et al. 2014) to determine how best to design an experiment • Considerations • Size of manipulation • Does total connectivity matter more, or how it is arranged? • How does slope/texture/depth to B horizon matter? • Precipitation • Land Use • The conceptual work for connecting ECOTONE and WEMO has been done, implementation and model experiments next…
ECOTONE-WEMO Model Framework


