Download
1 / 31
310 likes | 330 Views
Explore the impact of flat vs. curved surface stresses on tire temperatures and pressures. Study curved surface equivalency to highway conditions, enhancing tire performance and safety. Apply statistical models and experimental steps for accurate results.

E N D
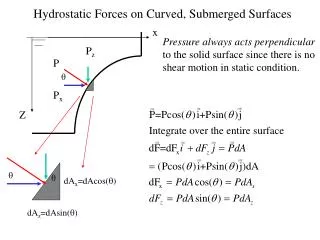
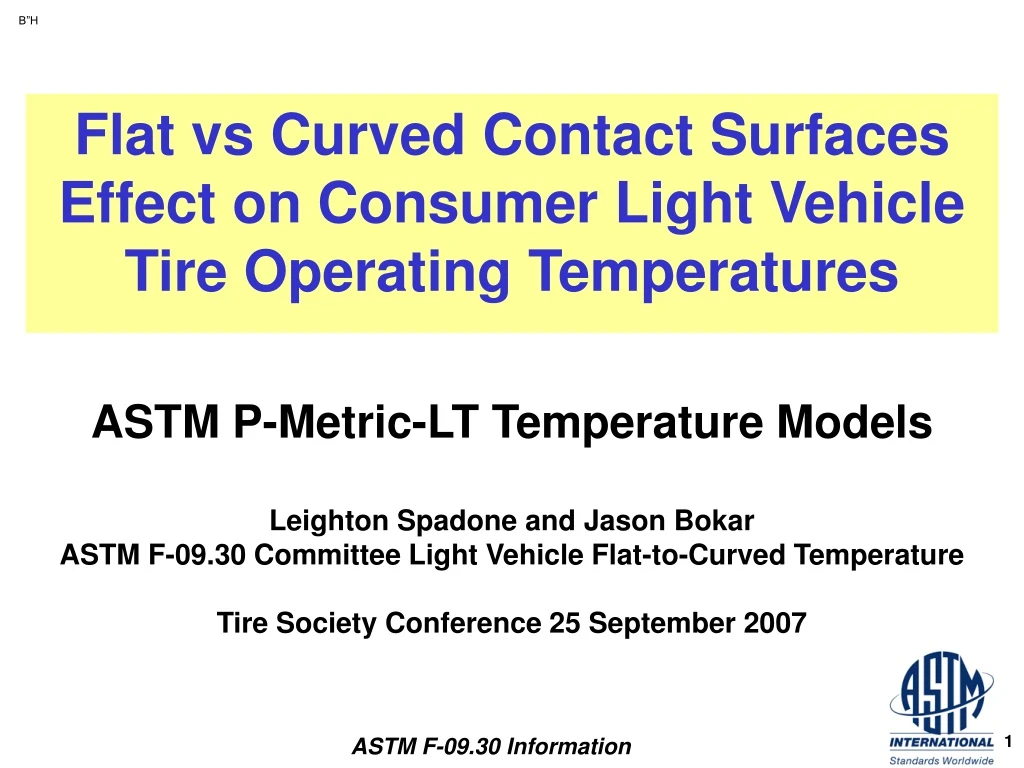
ASTM P-Metric-LT Temperature ModelsLeighton Spadone and Jason BokarASTM F-09.30 Committee Light Vehicle Flat-to-Curved Temperature Tire Society Conference 25 September 2007 Flat vs Curved Contact Surfaces Effect on Consumer Light Vehicle Tire Operating Temperatures
Tread Act DOT-NHTSA Action: • FMVSS139 Increased Severity Tire Test Standards compared to FMVSS109. • Stepped Endurance Test effective Sep2007 • Non-Representative Tire Removal Reasons • ASTM Response to NHTSA: • The ASTM F09.30 Flat-to-Curved Equivalent-Temperature Task Group Committee should provide technically based information on tire running temperatures to support tire test rulemaking.
What’s the Problem • Consumer Tires operate on a Flat Surface but NHTSA tests require an industry standard, 1.7 meter diameter, Curved Surface. • Increased Curved Surface Stresses may lead to atypical tire removals.
Objective • Determine FMVSS130 Curved Surface temperatures their equivalent Flat Highway conditions and temperatures.
Wheel Curvature Effect on Tire Deflection . Flat Surface 100% load, 100% inf Curved Surface 100% load, 100% inf Increased Deflection and three Curved Surface inflection points vs a Single Flat inflection point
10.0 9.2 8.5 7.7 7.0 6.2 5.5 4.7 4.0 3.2 2.5 1.7 1.0 Curvature Effect on Footprint Pressure 265/60R18 @ 2 Bar & 1056 Kg SURFACE = FLAT SURFACE = 1.7 meter diameter peak pressure ~8.6 Bar peak pressure ~5.9 Bar Bar -21% Footprint length +21% Mean shoulder footprint pressure +40% Maximum shoulder footprint pressure
What We Want to Communicate about Curved Surface Stresses at equal Conditions. Increased Flex Cycles Reduced Footprint Increased Pressure Increased Tire Temperatures • Increased Flex Cycles • Increased Deflection • Reduced Footprint • Increased Pressure
Assumption • Tire Running Temperatures are a result of the Operating Conditions as reflected through the tire Construction and Materials response to Operating Conditions Stress. Tire Materials Tire Construction Dimensional Stress Tire Running Temperature Load Inflation Speed Surface Curvature Ambient Temperature Modeling Tire Operating Conditions
Challenge Communicate Flat-to-Curved Temperature Changes Tire Temperature Statistical Models
Iterative Action Plan DOE and Test Tire Selection Measure Tire Temperatures on Flat and Curved Surfaces Model and Predict Tire Temperatures Determine Flat-to-Curved Effects in terms of Tire Temperature and Operating Conditions
Thermocouple Locations Belt Edge was primary Hot Spot
Tire Thermocouple Test Environment Highway Test Track Curved Wheel Flat Track
Experimental Steps • Phase I & 2: • Thermocouple, Test, and Model the ASTM Tire Sizes • Validate ASTM Phase 1&2 Model with RMA dataset. • Phase 3: • Expand Range of Sizes and Types to Generalize Model • Increase model size and stability • Add Centerline couple to model as secondary Hot Spot
ASTM Tire Belt Edge Temperature Model • SAS JMP Regression Modeling • Fit=.95 for the 255 observations available
ASTM Tire Belt Edge Temperature Model • %LF, %SR, and %INF are the most important predictors and account for more that 70% of the Fit. • The effect of Ambient Temperature is curvilinear. • Collinear Predictors • The MPH and %SR pair and the Const and NS_MM pair may be exchanged to produce slightly different models with similar fit.
ASTM Hot Spot Models Summary Communicate Model Implications
FMVSS139 Flat-to-Curved Equivalent Conditions Adjust the FMVSS139 curved test conditions to produce temperatures equal Flat Highway temperatures generated at the original conditions.
Situation • Running Highway conditions on the wheel will increase the tires temperature due to the higher curved Roadwheel stress. • How should Highway conditions be adjusted when run on the curved wheel, to produce tire running temperatures approximately equal to the original Highway condition?
Adjust Curved Conditions to equal Flat Temperatures @ Original Conditions • Minus 10% Load and Plus 10% Inflation @75 MPH
15 12 9 6 BE Flat-Curved DegC 3 0 -3 -6 -9 -12 -15 7 8 9 10 11 12 13 14 15 16 17 18 19 Tread Depth NS MM Zero ΔTemperature Curved-to-Flat Load & Inflation Pressure Solution by FMVSS139 Step Hotter Highway Step4: 90%LOAD 68%INF Step 2-3: 80/90%LOAD 85%INF Step1: 75%LOAD 85%INF Hotter Roadwheel
140 130 120 110 Flat BE DegC 100 90 80 70 7 8 9 10 11 12 13 14 15 16 17 18 19 Tread Depth NS MM Flat Belt Edge Temperature for each FMVSS139 Step Conditions Flat=Step4: 100%Load 58% INF Flat=Step3: 100%Load 75% INF Flat=Step2: 100%Load 75% INF Flat=Step1: 100%Load 75% INF
Summary • Other Temperature Equivalence solutions are possible but a simple, consistent adjustment was chosen. • Curved Condition Adjustment for 75 MPH FMVSS139Test: Minus 10% Load and Plus 10% Inflation
FMVSS139 Curved-to-FlatConditions Equivalency Translate FMVSS139 Curved Conditions to Flat Highway Conditions at Equal Temperatures
Flat Speed Solution @ FMVSS139 Step Conditions %LOAD and %INF are Unchanged
15 13 11 9 7 5 3 BE Flat -Curved DegC 1 -1 -3 -5 -7 -9 -11 -13 -15 7 8 9 10 11 12 13 14 15 16 17 18 19 Tread Depth NS MM Zero ΔTemperature Flat-to-Curved Speed Solution by FMVSS139 Step Hotter Flat Step1-2: 97-98 MPH Solution Step 3-4: 92-93 MPH Solution Hotter Roadwheel
160 150 140 130 Pred BE DegC 120 110 100 90 80 7 8 9 10 11 12 13 14 15 16 17 18 19 Tread Depth NS MM FMVSS139 Belt Edge Temperature by Step Step4: 100%Load 58% INF Step3: 100%Load 75% INF Step2: 90%Load 75% INF Step1: 100%Load 75% INF
Summary • TheTire Running Temperature was Statistically Modeled as a function of Speed, Load, and Inflation with adjustments for Ambient Temperature, Deflection, and a Construction Index.
Conclusions • Curved Roadwheel tire testing is more severe than the Flat Highway. • Adjustment to the Curved Wheel Conditions to match Flat Highway Temperature is: -10% Load +10% Inflation: @75 MPH • Highway Speeds of 92 to 98 MPH match the FMVSS139 Step Roadwheel temperatures.