Download
1 / 8
110 likes | 407 Views
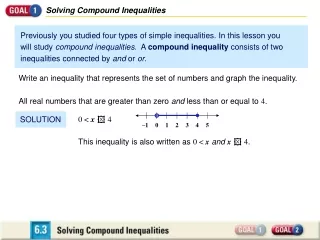
Solving Absolute-Value, Compound, and Quadratic Inequalities. Reminder: Compound Inequalities. The following are examples of how to algebraically write the following graphs:. 0 ≤x<4. 0 4. x<-1 or x>2. -1 2. REMINDER. How to solve a one variable inequality.

E N D
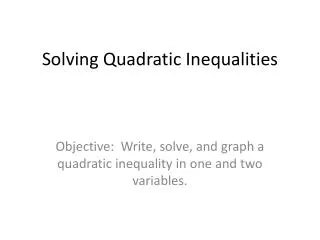
Solving Absolute-Value, Compound, and Quadratic Inequalities
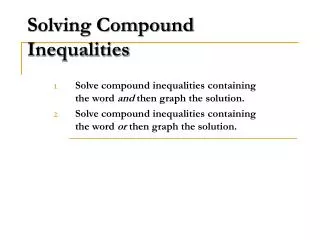
Reminder: Compound Inequalities The following are examples of how to algebraically write the following graphs: 0≤x<4 0 4 x<-1 or x>2 -1 2
REMINDER How to solve a one variable inequality.
Solving a 1 Variable Inequality Represent the solutions to the following inequality algebraically and on a number line. Closed or Open Dot(s)? Graphical Solution Find the Boundary Test Every Region x Change inequality to equality 0 Pick a point in each region x = 3 x = 0 Solve Substitute into Original 7 < 12 13 < 12 True False Shade True Region(s) Plot Boundary Point(s) Algebraic Solution
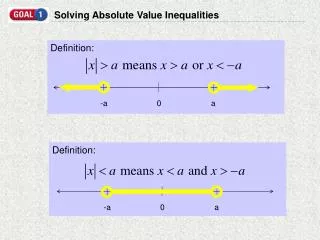
Solving an Absolute Value Inequality Represent the solutions to the following inequality algebraically and on a number line. Closed or Open Dot(s)? Graphical Solution Find the Boundary Test Every Region x Change inequality to equality 0 Pick a point in each region Solve x = 6 x = 0 x = -2 Substitute into Original 2 > 3 4 > 3 4 > 3 False True True Shade True Region(s) Algebraic Solution Plot Boundary Point(s)
Solving a Compound Inequality Represent the solutions to the following inequality algebraically and on a number line. Closed or Open Dot(s)? Graphical Solution Find the Boundary Test Every Region x Change inequality to two equalities 0 Pick a point in each region Solve Both x = 4 x = 0 x = -3 Substitute into Original -12<-8≤-2 -12<0≤-2 -12<-14≤-2 True False False Shade True Region(s) Plot Boundary Point(s) Algebraic Solution
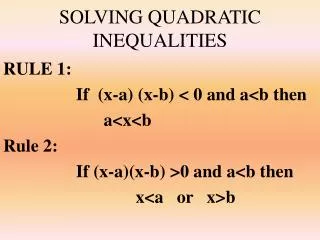
Solving a Quadratic Inequality Represent the solutions to the following inequality algebraically and on a number line. Closed or Open Dot(s)? Graphical Solution Find the Boundary Test Every Region x Change inequality to equality 0 Pick a point in each region Solve x = 2 x = 0 x = -4 Substitute into Original 1 < 4 9 ≤4 9 < 4 True False False Shade True Region(s) Algebraic Solution Plot Boundary Point(s)