Download
1 / 18
180 likes | 300 Views
Western Great Basin Reflectance Analysis and Model Performance ATMS 792 – Remote Sensing. Outline. Data used / Domain of study / Hypothesis Model algorithm How does this model perform for our region? 2-D spatial plots Scatter plots Magnitude of error dependent on region

E N D
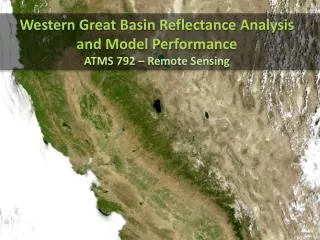
Western Great Basin Reflectance Analysis and Model Performance ATMS 792 – Remote Sensing
Outline Data used / Domain of study / Hypothesis Model algorithm How does this model perform for our region? 2-D spatial plots Scatter plots Magnitude of error dependent on region Overall climo(kind of…) stats Conclusion
Data / Methods Reduce noise and parse out mostly clear days for June-July 2010/2011 Month w/ least amount of erroneous surface reflectance values Minimal monsoonal influence Hand picked 24 days total to work with 13 days in 2010 11 days in 2011 NOTE: Snow caps during summer add higher values = increased variance
Theoretical Model EquationsRemer (2005) • Needs clear skies……… Good luck • Needs clean air…….. Good luck again • Works well in vegetated regions. Really? • How about arid regions? (East of Reno)
Raw images and their respective reflectance21 June 2011 (Upper-level Cirrus) 470nm 2130nm 660nm
Raw images and their respective reflectance5 July 2010 (Perfectly clear) 470nm 2130nm 660nm
Raw images and their respective reflectance8 July 2011 (Perfectly clear) 470nm 2130nm 660nm
Spatial Anomalies (Target minus Predicted)5 July 2010 470nm 660nm • Model under predicts reflectance at both wavelengths • Green-vegetated areas with no snow closely agree w/ model
Spatial Anomalies (Target minus Predicted)8 July 2011 470nm 660nm • Model under predicts reflectance at both wavelengths • Green-vegetated areas with no snow closely agree w/ model
Divide data into two domains Green/Lush/Forest Dry/Arid/Desert ~ 9500 data points in each box How does the Remer (2005) equation perform in both regions?
So how does the model perform in the two different land regimes?5 July 2010 – Dry Regime 660nm Scatterplot 470nm Scatterplot Y=.25x Y=. 5x • 470nm consistently out performs 660nm • Average Error and RMSE always greater at 660nm
So how does the model perform in the two different land regimes?5 July 2010 – Forest/Lush Regime 660nm Scatterplot 470nm Scatterplot Y=. 5x Y=.25x • Weird “line” of data points may be due Lakes in domain (1:1 ratio) • Only ~1-1.5% error
So how does the model perform in the two different land regimes?8 July 2011 – Dry Regime 660nm Scatterplot 470nm Scatterplot Y=.25x Y=. 5x • 470nm again out performs 660nm statistically
So how does the model perform in the two different land regimes?8 July 2011 – Forest/Lush Regime 660nm Scatterplot 470nm Scatterplot Y=.25x Y=. 5x • Huge snow season before this summer • More widespread snow pack increases variance • Still only 5% error
Conclusion Observed reflectance > model reflectance in dry/desert regions of W. Great Basin Observed reflectance is higher in mountains/forest/lush areas But… Data is skewed higher due to snow caps Would be almost 1:1 if snow caps didn’t exist. Difficult to measure performance of observed and model due to seasonal variance (i.e. snow caps, monsoonal cloud tops, etc.) Model best used in “greener” regionsand not highly reflective desert surfaces Best results after “drier” wet seasons. Filtering/smoothing process could have been used but this muddles raw data.