Download
1 / 7
70 likes | 195 Views
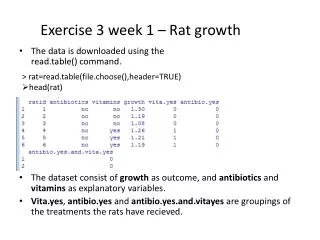
Exercise 3 week 1 – Rat growth. The data is downloaded using the read.table () command . The dataset consist of growth as outcome , and antibiotics and vitamins as explanatory variables.

E N D
Exercise 3 week 1 – Rat growth • The data is downloadedusing the read.table() command. • The datasetconsist of growth as outcome, and antibiotics and vitamins as explanatory variables. • Vita.yes, antibio.yes and antibio.yes.and.vitayesaregroupings of the treatments the rats have recieved. • > rat=read.table(file.choose(),header=TRUE) • head(rat)
A two-way ANOVA model is fitted to the data and the model is checked. The statistical model is equal to:Expectedgrowth(antibio.yes=x, vita.yes=y, antibio.yes.and.vita.yes=z) = parameter1 + paramter2*x + parameter3*y + parameter4*z In R: A two way ANOVA with growth as response variable: fit2wayANOVA=lm(growth~antibiotics*vitamins,data=rat) coef(fit2wayANOVA) (Intercept) antibioticsyes 1.1900000 -0.1566667 vitaminsyes antibioticsyes:vitaminsyes 0.0300000 0.4800000
Making a residual plot and QQ-plot • par(mfrow=c(1,2)) • plot(fit2wayANOVA,which=1:2) Both plots looks good. Could have beennice to have more observations to get a more clear picture
Testing for the hypothesis of noeffectmodification by making an F-test : H0=No combined effect of vitamins and antibiotic treatment on rat growth > fitnomod=lm(growth~antibiotics+vitamins,data=rat) > anova(fit2wayANOVA,fitnomod,test="F") Analysis of Variance Table Model 1: growth ~ antibiotics * vitamins Model 2: growth ~ antibiotics + vitamins Res.Df RSS Df Sum of Sq F Pr(>F) 1 8 0.029333 2 9 0.202133 -1 -0.1728 47.127 0.000129 *** --- Signif. codes: 0 ‘***’ 0.001 ‘**’ 0.01 ‘*’ 0.05 ‘.’ 0.1 ‘ ’ 1 Ho is rejected (p<0.001), so there is an effect of modification
This equals setting one parameter to 0 Recall: coef(fit2wayANOVA) (Intercept) antibioticsyes 1.1900000 -0.1566667 vitaminsyes antibioticsyes:vitaminsyes 0.0300000 0.4800000 And Expected growth(antibio.yes = x; vita.yes = y; antibio.yes.and.vita.yes = z) = parameter1 + parameter2*x + parameter3*y + parameter4*z #the test corresponds to a multiple linear regression, so parameter2-4 is the expected difference between two experimental units for which the given variable differs by one, but all other explanatory variables are the same. #if we create a linear model where parameter4 = 0, hence no effect of a combined vitamins and antibiotics treatment, we get lm(growth~antibiotics+vitamins,data=rat)


![[Exercise Name] Functional Exercise](https://cdn0.slideserve.com/621913/exercise-name-functional-exercise-dt.jpg)

![[Exercise Name] Full Scale Exercise](https://cdn0.slideserve.com/1378878/exercise-name-full-scale-exercise-dt.jpg)