Download

1 / 38
380 likes | 605 Views
Psychology 242, Exam 2 overview. 3/16/14. This exam is worth 10% of your grade. Items will be very similar to exam #1 Exam 2 focuses on lectures and readings after exam 1 :

E N D
Psychology 242, Exam 2 overview 3/16/14 This exam is worth 10% of your grade. Items will be very similar to exam #1 Exam 2 focuses on lectures and readings after exam 1: Core design issues, Descriptive data,Surveys, Scales and Frequency Distributions (from the beginning of the Statistics section. Descriptive Research.
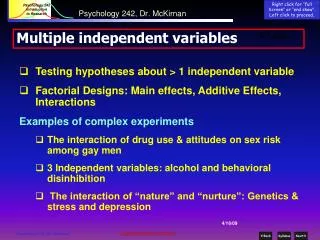
Overview • Experimental design key elements • Control group v. non-controlled designs • Threats to internal validity: • Maturation • History • Mortality • Regression to baseline • ReactiveMeasurement I may ask you to define one or two of these (slide 12). • “Pre-experimental” designs • Pre-post designs • Multiple group comparisons. Week 3; Experimental designs
Design & validity overview Other outcomes (dependent variables) Other conditions (independent variables) The larger population Other settings External Validity How well can we generalize to: Understand this. What might be an example of each “arm” of external validity? • Internal validity • What is a confound? • Non-random group assignments • Procedures • Unmeasured 3rd variables Experimental Design & sampling
Design & validity, 2 • Some key terms: • Replicate • “Converging” study • Blind • Double blind • Social desirability responding • Reactive measures • Operational Definitions, • hypothetical constructs. Group 1 Observe1 Treatment 1 Observe2 Group 2 Observe1 Treatment 2 Observe2 Group Assignment Baseline (pre-test) Experimental condition Follow-up (post-test) Control Group 3 Observe1 Observe2 Experimental Design & sampling
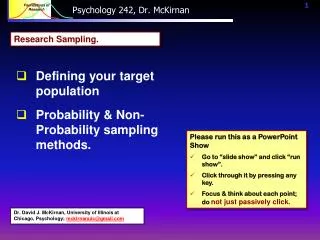
Overview, 3 • Probability sampling • simple • multi-stage • stratified • Most externally valid • Assumes: • Clear sampling frame • Population is available • Less externally valid for hidden groups. Be able to talk about basic sampling questions in YOUR course research project. Understand this basic distinction (especially in terms of external validity). • Non-probability sampling • targeted / multi-frame • snowball • quota, etc. • Less externally valid • High “convenience” • Best when: • No clear sampling frame • Hidden / avoidant population. Week 6; Sampling
Quasi-experiments; Summary 2. Evaluate existing groups or program(s), or issues where groups cannot be equivalent at baseline • Single shot survey or measure of an intervention • Non-equivalent / pre-existing groups • Time series designs, often with archival data • 1. Study naturally occurring events that could not be brought into a lab or a true experiment. • Measurement studies of, e.g., disasters, historical events • Retrospective designs • Understand these two basic forms of research. • Be able to provide an example of each. • Be able to discuss the internal v. external validity trade-off for each. • Trade off internal for external validity Week 12-13, quasi-experimental designs.
Exam issues • Key exam issues: • Slide 11: “true” v. quasi –experiments • Threats to internal validity • Basic forms of quasi-experiments • Single group pre- post- test • “Non-equivalent” two group designs: • Self-selection (in or out [mortality]) • Existing groups • Non-blind • Non- random assignment • Interrupted time-series / group contrasts • Virtues (external validity) and problems (internal validity) • Understand how and why groups may be “non-equivalent”: see the next two slides. Week 12-13, quasi-experimental designs.
Non-equivalent two-group designs #1; Static Group Design Groups are not equivalent at baseline, due to.. • Self-selection • Non-random assignment • Use of existing groups • Participants not blind Intervention or event Observe1 Group1 (No baseline) Contrast group Observe1 Group2 • Assessments may or may not be controlled • Survey or interviews • Archival / existing data, e.g., clinic records, grades • Intervention or event may or may not be controlled by researcher; • Existing program • Experimental intervention • Naturally occurring event (..9/11..) Week 12-13, quasi-experimental designs.
Non-equivalent designs; pre- post- #2 Two Group Pre- Post- Design Non-equivalent groups • Self-selection • Non-random assignment • Use of existing groups • Participants not blind Group Observe1 Intervention or event Observe2 Group Observe1 Observe2 Contrast group Intervention & Assessments typically controlled or designed by the researcher in these designs. Similar to true experimental design, except for non-equivalent groups Week 12-13, quasi-experimental designs.
True v. quasi-experimental designs • Take a good look at this slide Week 12-13, quasi-experimental designs.
Key design feature in simple pre- post- quasi-experiments: Lack of control group. Observe1 Confound Observe2 Group Observe1 Intervention or event Observe2 Threats to internal validity (confounds): Q: When do these issues create confounds? A: When the experimental & control groups differ on one of these. Q: When do they just add junk variance to the study? A: When the groups are equally prey to one of these. Historical / cultural events occur between baseline & follow-up. • History • Maturation Individual maturation or growth occurs between baseline & follow-up. • Reactive measures People respond to being measured or being a measured a second time. • Statistical regression Extreme scores at baseline “regress” to a more moderate level over time. • Mortality / drop-out People leave the experiment non-randomly (i.e., for reasons that may affect the results…). Week 12-13, quasi-experimental designs.
Understand time series data, e.g.: Statistics introduction 1
Also understand … Statistics introduction 1
Right click for “full Screen” or “end show”. Left click to proceed, Psychology 242, Dr. McKirnan 3/10/10 Descriptive research Simple but important: “Descriptive” or survey research does not just count stuff. They can test hypotheses. • Basic overview of a behavior • “Who, what, where & when” • … In depth (qualitative) portrayal of the behavior • Generate hypotheses • Use qualitative or quantitative descriptions to begin asking “why?” or “how?” a behavior occurs. • Develop hypotheses about how to change a behavior… Descriptive Research.
Forms of descriptive research • Study behavior “in nature” (high ecological validity). • Qualitative • In-depth interviews • Focus (or other) groups • Textual analysis • Qualitative quantitative • Observational • Direct • Unobtrusive • Use existing data for new quantitative (or qualitative) analyses • Accretion • Study “remnants” of behavior • Wholly non-reactive • Archival • Use existing data to test new hypothesis • Typically non-reactive Describe an issue via valid & reliable numerical measures Simple: frequency counts of key behavior “Blocking” by other variables Correlationalresearch: “what relates to what” Complex modeling • What are these approaches? • What would be an example? • When might you use them? Descriptive Research.
Naturally occurring events:Correlational designs • Testing hypotheses with simple correlations: • Procedures: • Careful selection of sample to reflect target population • Systematic development of measurements: • Core virtues: • “Natural” look at how variables relate • Less control = less reactivity than experimental designs • Can model very complex phenomena • Reliability • Validity Descriptive Research.
Correlation designs: Drawbacks & fixes 1. Causality; a simple correlation may confuse cause & effect: which causes which?. ? Alcohol consumption Depression 2. Confounds!; unmeasured 3rd variable problem: is something else causing both our measured variables. General optimism • Understand both these problems in inferring causality from a simple correlation. I will ask you about them!! ? Hemlines Stock market Descriptive Research.
Observational Research • Assess behavior directly rather than by participants’ self-reports or recall • Typical data collection is highly reactive: participants know they are being studied, and react to that • Observational methods are often less (or non-) reactive. • Directly observe the social & physical settings or environments of behavior Descriptive Research.
Observational research: methods • Direct observation; visual observation & note taking or recording • Unobtrusive observation; participants unaware of data collection • Major advantage: Eliminate reactive effects of data collection • Participant observation; become part of social phenomenon to describe it e.g., sitting in on classroom discussion, therapy session, etc. e.g., 1-way mirror & therapy research, “stake out” drug scene e.g., joining political organization or cult, posing as prostitute (c.f.; Hunter S. Thomson Hells Angels; NY Times Down Low article here). Descriptive Research.
Descriptive methods: design issues, 3 • Reactive measurement • Participants react to the knowledge that they are being measured. • Threatens External Validity if all participants are giving skewed answers due to the the measures. • Threatens Internal Validity – is a confound - if participants in one group have more reactive measures than the other group. • Reactive bias increases with.. • Clarity (face validity) of measures • Face-to-face interview methods • Often lessened with computer interviews • Understand how something like reactive measurement • Can just add error (junk variance) to the data, or can… • Represent a confound. • Also get: • Error variance only = threat to external validity • Confound = threat to internal validity Descriptive Research.
Use of Existing data Accretion; Study remnants of behavior • Data wholly unobtrusive / non-reactive • Indirect; may only partially map onto phenomenon. Archival; data collected for other purposes • Often in highly reliable, large & rich data sets • Provide unbiased correlations, but most be adapted to new purpose or hypothesis (may not “map on” fully..). • Generally understand what these methods are and why we use them. • Look at the lecture notes for examples. Descriptive Research.
Descriptive Research: Overview • Basic design issues: • Time frame • Cross sectional • Longitudinal • Case study • Reliability • Test – retest • Split – half • Alpha (internal) • Validity • Face • Content • Predictive • Construct • Ecological • Look at your lecture notes or book for definitions of these. • Do not spend a lot of time on these… • However: I do want you to know what the two aspects of Construct Validity are. Go to the lecture slides for this. Descriptive Research.
Surveys: overview • These are the key concepts in surveys; be able to give an example of them or say why they are important. • knowledge • Beliefs • Behavior • Core topic areas • Descriptive data • Hypothesis testing • Pragmatic; planning & evaluation • Uses of surveys • Closed v. open-ended • Face-to-face (interview, telephone) • Questionnaire (pencil & paper, internet). • Survey formats • Access to the target population • Social desirability • Time frame of question • Question order • Bias, political uses of surveys • Participant sophistication • Issues in survey design Survey research
What do surveys measure? • Knowledge • Information re: current events, political or consumer choices • Awareness of Public health resources, health practices, etc. • Attitudes and Beliefs • Preferences or evaluations: e.g., attitudes toward gays, ethnic groups, etc., consumer preferences. • Beliefs about political or social events: “which party provides the strongest security for the U.S….?” • Feelings or moods: quality of life, depression / anxiety, marital satisfaction, etc. • Behavior • Behavioral intentions; Intent to vote, financial plans, etc. • Self-reportsof previous or on-going behavior; topics range from voting to alcohol and drug use. • What might be some examples of these? Survey research
Closed-ended items, summary • Chief virtue: clear operationalization • Very specific & concrete; know exactly what participant is responding to • Easy to quantify & use statistically • Can be tested for reliability • Chief liability: potential insensitivity • Often brief, simply worded; potentially superficial • “Top down”; issues or constructs are imposed on participant • Discrimination studies: no option for “has no attitude” • Clinical / psych.; not sensitive to participants’ personal perspectives. Understand: • Closed v. open-ended items, • Examples of each • Advantages & disadvantages of each Survey research
Survey formats; “Open-ended”items General textual / qualitative response; More sensitive to the respondent How have you enjoyed your methods class so far? Please list the three things that first come to mind when you think of Psychology 242. • Virtues and drawbacks of qualitative or “open ended” items? • What might be an example? • More difficult to interpret • Can be analyzed as qualitative data(see discussion in Descriptive data.) • Can be quantified; • frequency counts of citations or statements • “linkages” analysis of co-occurring statements • Often presented as textual portrayal plus minor quantitative analysis. Survey research
Example of mixed survey formats Closed-ended attitude scale Open-ended description Simple behavioral index. Example of mixed question format from survey of women’s sexual practices. Personal Safer Sex Guidelines How strict are your personal guidelines or rules for safer sex (e.g., condom use, “safe relationships,” etc.)? 1 2 3 4 5 6 7 Not at all Somewhat Very Extremely strict strict strict strict What are your rules for safer sex? Have you ever refused to have sex 0 1 2 3 with someone in order to stay safe?Never once or a few many twice times times Understand how / why these are different, advantages & disadvantages, types of data you use each for. Survey research
Social Desirability Responding • Clear face-valid items addressing embarrassing topics yield less valid responses • How often are you dishonest with your friends? • Have you ever cheated on an exam....? • High social desirability wording elicits inaccurate responses… • Do you support protecting our Nation’s forests for future generations? (Does “yes” make you an “environmentalist”?). • Do you feel there are ways your husband could be closer...? (Does “yes” make you are unhappy in your marriage”?). • Populations differ in social desirability responding; confound in analyses of population effects • Women report more suicidal thoughts, but may be more willing to disclose, creating a possible confound… • Desirability can be minimized by: • Anonymous surveys • Assurances of confidentiality • Computer administration (no personal interaction) • Careful wording / pilot testing of items Understand the basic issues here Survey research
Survey summary • Surveys typically use multiple items to measure each hypothetical construct • Correlations among items tell us if they are reliable in measuring the same construct. • We use Mediating Analyses to • Test hypotheses about correlations between constructs • Build or test theory • Cross-sectional analyses are difficult to interpret • Causal direction? • 3rd variable problem • Longitudinal analyses help us determine causal direction Summary Understand the highlighted terms Survey research
Survey administration • Internet increasingly important as self-report method • Face-to-face interviews more common in clinical research • Time frames & question order can influence responses • Population access & sophistication • Some groups are difficult to reach • Creates threat to External validity • Assumption that participants understand survey materials often questionable. • Social desirability responding • Inhibited responding threatens Internal Validity • May represent a confound if groups differ in desirability set. Summary Understand the highlighted terms
Manipulating attitudes by surveys 1. Ask manipulative or highly leading questions 2. Find high levels of agreement (and potentially change participants’ attitudes). 3. Publicize – and often distort or overstate – the “findings” via highly biased news sources 4. News reports themselves lead to attitude change among people who are uncertain or uninformed. Summary Understand this process; what might be an example? Survey research
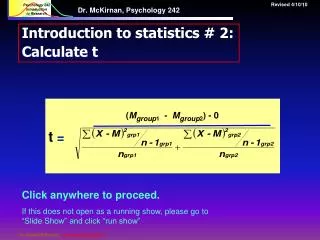
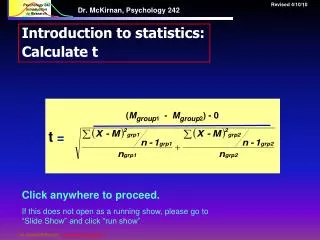
Some basic terms: You all get these I am sure… Characteristic or attribute with different levels or qualities • Variable One level or state of a variable. • Value • Distribution Set of scores (each with its own value) for one variable. • Central Tendency Primary “drift” of a set of scores (Mean, Mode, or Median). Measure of how much the scores in a distribution differ from each other. • Variance Mathematical characteristic of a population. • Parameter • Statistic Mathematical characteristic of a sample. Statistics introduction 1
Types of numerical scales • Ratio • Scales of physical properties. • Used for physical description: temperature, elapsed time, height Interval Arbitrary or relative ψscales Common in behavioral research, e.g., attitude or rating scales. Ordinal Rank order with non-equal intervals Simple finish place, rank in organization, most, 2nd most, 3rd most... Categorical Categories only Typical of inherent categories: ethnic group, gender, zip code Continuous Scales Be able to provide examples. Which of these scales will youuse for your study? Why? Statistics introduction 1
What is a Frequency Distribution? • We plot each “data point” • (a score for one person…) • on an axis of scores. • Scores are on the the “X” axis • Frequencies on the “Y” axis.. • We show the shape of a distribution by drawing a curve over the cluster of data points… The “Y” Axis 15 14 13 12 11 10 9 8 7 6 5 4 3 2 1 0 X X X X X X X X X X X X X X X X Frequency You should certainly know what a basic frequency distribution looks like. X X X X X X X X X X X X X X X X X X X 9 participants got a score of ‘3’ 4participants got a score of ‘6’ 16 participants got a score of ‘4’ X X X X X X X X X X X The “X” Axis 1 2 3 4 5 6 7 Scores Psychology 242, Dr. McKirnan Statistics introduction 1 Descriptive Research.
The normal distribution • In a “normal” distribution • Scores are symmetrical around the mid-point • The variance in scores shows the classic “Bell Shape” X X X X X X X X X X X X X X X X 15 14 13 12 11 10 9 8 7 6 5 4 3 2 1 0 X X X X X X X X X X Frequency X X X X X X X X X Should be obvious X X X X X X X X X X X 1 2 3 4 5 6 7 Scores Statistics introduction 1
Less “normal” distributions • Score distributions may depart from the Bell Curve • Scores here are still symmetrical • The variance is “flat” or irregular 15 14 13 12 11 10 9 8 7 6 5 4 3 2 1 0 X X X X X X X X Frequency X X X X X X X X X X X X X X X X X X X X X X X X X X X X X X X X X X X 1 2 3 4 5 6 7 Scores Statistics introduction 1
Skewed distributions • Distributions may be very “non-normal” • Here scores are not symmetrical • This is called a “skewed” distribution; scores load up on one side of the scale. Center of the distribution 15 14 13 12 11 10 9 8 7 6 5 4 3 2 1 0 X X X X X X X X X X X X Understand clearly that many important variables - behavioral and otherwise - are NOT normally distributed… XXXXX X X X X X X Frequency X X X X X X X X X X This is a positive skew; the “tail” of the distribution goes toward higher values X X X X X 1 2 3 4 5 6 7 Scores Statistics introduction 1
Less “normal” distributions Other data may show a negative skew. 15 14 13 12 11 10 9 8 7 6 5 4 3 2 1 0 X X X X X X X X X X X X XXXXX X X X X X X Frequency Ditto… X X X X X X X X X X X X X X X 1 2 3 4 5 6 7 Scores Statistics introduction 1