Download
1 / 37
390 likes | 749 Views
Image and Video Quality Assessment Subjective Testing. Dr. David Corrigan. Outline. Motivation Subjective Image and Video Quality Assessment Test Methodologies Benchmarking objective Metrics Objective IQA Metrics Metrics based on models of the HVS Metrics based on structural distortion

E N D
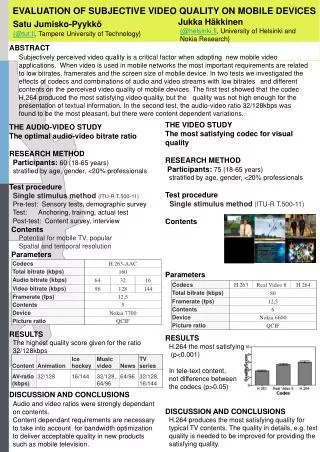
Image and Video Quality Assessment Subjective Testing Dr. David Corrigan
Outline • Motivation • Subjective Image and Video Quality Assessment • Test Methodologies • Benchmarking objective Metrics • Objective IQA Metrics • Metrics based on models of the HVS • Metrics based on structural distortion • Objective VQA Metrics • Metrics based on HVS • “Feature-based” metrics • “Motion-based” metrics Covered in this Presentation
Motivation • Our main motivation for studying IQA and VQA is compression. “The intent of the H.264/AVC project was to create a standard capable of providing good video quality at substantially lower bit rates than previous standards (i.e., half or less the bit rate of MPEG-2, H.263, or MPEG-4 Part 2)” “The preliminary requirements for NGVC (H.265) was the capability to have a bit rate reduction of 50% at the same subjective image quality compared to the H.264/MPEG-4 AVC High profile”
Motivation • Also for Restoration and Enhancement How good is our algorithm at removing blur from the picture?
Motivation- better to be aggressive or conservative? • We can use VQA to tune the restoration algorithm to get the best possible result. Aggressive Restoration Conservative Restoration Distorted Video
Categories • Full Reference algorithms (eg. MSE) • In full reference algorithms the distorted (or test) image/video is compared with an undistorted reference image/video. • We are measuring the relative quality of the distorted signal compared to the reference. • No Reference Metrics • Attempt to define an absolute measure of quality of a distorted signal. • Difficult to define a general purpose metric. Easier to define metrics for individual distortions (eg. JPEG blocking artefacts, blur etc.) • Reduced Reference Metrics • Similar to full reference except we do not have access to the full reference but rather a set of features calculate on it that allows us to measure relative quality. • We will only be considering full-reference algorithms in this course.
Motivation • Development of IQA and VQA algorithms is a hot topic in the research community because • MSE or PSNR do not align well with perception. • Subjective Testing is expensive, time consuming and often impractical.
Motivation Ref. Image Each Distorted Image has roughly the same MSE when compared with the reference image (top left)
Subjective Testing • Subjective Testing in most scenarios maybe impractical but we still need them to benchmark the objective metrics that we design. • The Video Quality Experts Group (VQEG) was set up in 1997 to establish a standardised benchmark for evaluating proposed VQA metrics • A group made up of university academics and industry and regulatory experts. • Membership is open, just join the mailing list. • Algorithms were tested against a database of videos that were subjectively tested.
VQEG Projects • FRTV Phase 1 (2000) & FRTV Phase 2 (2003) • Evaluation of full-reference (FR) metrics for SD TV. • Resulted in ITU-T Rec. J.144 and ITU-R Rec. BT.1683 – full reference objective metrics for SD cable and broadcast TV. • Resulted in standardisation of 4 metrics. • Multimedia Phase 1 (2008) • Evaluation of full-reference, reduced-reference (RR) and no-reference (NR) metrics for low res (VGA and lower) multimedia applications. • Resulted in ITU-T Recs. J.246 and J.247 and ITU-R Recs. BT.1866 and BT.1867. This standardised a number of FR and RR metrics for multimedia applications. No NR metrics were standardised.
VQEG Projects • RRNR-TV (2009) • RR and NR Metrics for SD-TV • Resulted in ITU-T Recs. J.249 and J.340. Some RR metrics were standardised but no NR metrics standardised. • HDTV Phase 1 (2010) • FR, RR and NR metrics for HDTV • Resulted in ITU-T Recs. J.341 & J.342. No NR Metrics were standardised. • Ongoing VQA projects in VQEG • 3DTV • Audiovisual HD • High Dynamic Range (HDR) Video • Ultra HD
Subjective Testing • Subjective Testing is the Gold standard for quality assessment. • Goal is to generate an average opinion of absolute or relative quality for a given test image/video (aka Mean Opinion Score (MOS) or Difference MOS (DMOS)). • Users are usually asked to assign semantic labels to the videos that are processed to generate numerical MOS/DMOS scores • Absolute Label scale – (Bad, Poor, Fair, Good, Excellent) • Relative Scale – (No noticeable difference, perceptible but not annoying, slightly annoying, annoying, extremely annoying)
Performing Subjective Testing • Great care must be taken when planning, executing and processing results of subjective tests to avoid external sources of distortion affecting the (-/D)MOS values and to make them statistically meaningful. • The reference content must generalise well the type of content the algorithms are meant to be used on. • The distortions applied to the reference content must generalise the type of distortion typically found and their severity should span the range from not-noticeable to extremely annoying. • The test environment and display setup must be controlled to prevent variations impacting opinion scores.
Performing Subjective Testing • The test procedure including the length of test, the presentation of content, the input of opinion scores, number of subjects tested, screening of subjects etc. • Processing of Results – How MOS/DMOS scores are processed from the raw scores. Need to account for variations between subjects. We will briefly look at these issues and see how they are addressed by 4 perceptual studies. • VQEG – FRTV Phase 1 • VQEG – HDTV Phase 1 • LIVE Image Quality Assessment • LIVE Video Quality Assessment
Important References for this Section • FRTV Phase 1. Final Report From the Video Quality Experts Group on the Validation of Objective Quality Metrics for Video Quality Assessment, 2000 [Online]. Available: http://www.its.bldrdoc.gov/vqeg/projects/frtv_phaseI • HDTV Phase 1. Final Report, 2010. [Online]. Available: http://www.its.bldrdoc.gov/vqeg/projects/hdtv/hdtv.aspx • Int. Telecommun. Union, Methodology for the Subjective Assessment of the Quality of Television Pictures ITU-R Recommendation BT.500-13, Tech. Rep., 2000. • LIVE Image Quality Assessment Database, 2003 [Online]. Available: http://live.ece.utexas.edu/research/quality/subjective.htm • H.R. Sheikh, M.F. Sabir and A.C. Bovik, "A statistical evaluation of recent full reference image quality assessment algorithms", IEEE Transactions on Image Processing, vol. 15, no. 11, pp. 3440-3451, Nov. 2006. • LIVE Video Quality Assessment Database, 2003 [Online]. Available: http://live.ece.utexas.edu/research/quality/live_video.html • K. Seshadrinathan, R. Soundararajan, A. C. Bovik and L. K. Cormack, "Study of Subjective and Objective Quality Assessment of Video", IEEE Transactions on Image Processing, vol.19, no.6, pp.1427-1441, June 2010.
Subjective Testing Methodologies • Specifically this governs the way in which images/videos are presented to the user for evaluation. Commonly approaches used are • Single Stimulus Continuous Quality Scale (SSCQS) – LIVE Image and Video Databases • Double Stimulus Continuous Quality Scale (DSCQS) – VQEG FRTV Phase 1 • Double Stimulus Impairment Scale (DSIS) • Absolute Category Rating – Hidden Reference (ACR-HR) – VQEG HDTV Phase 1
Subjective Testing Methodologies • Single Stimulus v Double Stimulus • Single stimulus: All distorted and reference Images/Videos are arranged in random order for evaluation by the test subjects. • Double Stimulus: Each distorted image/video is displayed along with the reference signal. • Usually either immediately before or after the distorted signal • Double stimulus test methodologies • obviously more relevant to FR applications as it allows subjective comparisons between distorted and reference signals • User assigns a quality score for both the reference and distorted. signals • Also good at minimising bias in scores from perception of other signals in the test set. • Obviously not suitable for NR scenarios • Multiple evaluations of the same reference necessary if multiple distortions of it are in the test set
Subjective Testing Methodologies • Single Stimulus • For NR applications where the reference is absent • Can be used for FR and RR applications (eg. LIVE studies) • Scores can be influenced by perception of preceding images/videos in the test set. • Continuous Quality Scale (CQS) • The user assigns a rating between 0 to 100 to each presentation. • Typically the scale is broken down into a number of regions that are assigned labels describing the quality • Bad, Poor, Fair, Good, Excellent
Subjective Testing Methodologies Pen and Paper - Interface used in the DSCQS Tests for the VQEG FRTV Phase 1 database. The numbers at the top refer to the test sequence. A and B refers to the presentation of the double stimulus (ie. The ref or distorted signal) User marks each scale with a horizontal line intersecting the scale. Interface used in the LIVE Video Database Tests. The position on the slider is converted into a score
Subjective Testing Methodologies • Double Stimulus Impairment Scale • ITU-R Rec. BT.500 specifies DSIS • User directly asked to evaluate the level of distortion in the distorted signal compared to the reference. • only1 score per double-stimulus • Exclusively for use in FR QA studies. • ITU-R Rec. BT.500 specifies a discrete scale • Extremely Annoying • Annoying • Slightly annoying • Perceptible but not annoying • Imperceptible
ACR-HR (HDTV Phase 1) • A single stimulus methodology • Similar to SSCQS except it uses a discrete 5 scale rating instead of a continuous quality scale. • Bad, Poor, Fair, Good, Excellent. • Designed to be useful for testing FR, RR and NR methods • The reference images/videos are included in random positions in the test order. • For FR and RR the difference between scores from the distorted and reference signal is used to generate a reference score. • For NR testing the scores of the reference signals can be excluded. • Both LIVE Studies use a similar approach to adapt SSCQS to get difference scores for testing of FR algorithms.
Presentation of Stimuli • Important to minimise sources of systematic error and bias in scores and to ensure fair judgement of scores • Sequences should be presented in a different Random Order for each test subject. This prevents order from biasing the mean score for each presentation. • The start of the test session should include of number of dummy presentations (aka training) for which the score is ignored. This should give the subject a feel for what the subject will be asked. • A gap should be placed between each presentation of test image/video to allow the subject time to reflect. • Sometimes scores may only be made after the stimuli are presented. For example, in DSIS voting is only possible after both the distorted and reference signals have been displayed. • Sessions should be limited to 30 minutes to avoid fatigue.
Choice of Test Sequences and Distortion Conditions Test Image/Videos • Reference images/videos are chosen to cover a variety of content types including variations of content, colour properties, camera motion, object motion, scene cuts etc. • Usually reference footage is converted to a common format (resolution, frame rate, colourspace, chrominance subsampling etc) of relevance to the database • FRTV Phase 1 is concerned with SD TV so contains interlaced sequences at both 525 and 625 lines and 50 and 60 Hz (ie. PAL and NTSC Conditions) • LIVE Video is concerned with multimedia applications so uses progressive scan videos instead of interlaced videos.
Choice of Distortion Conditions • Distortion Types are chosen depending on the motivation for the assessment. • Different severities of each distortion type are applied to the reference signals. • The Video Test sets (LIVE Video, VQEG ) are concerned with distortions arising from compression and transmission errors (wireless or IP packet loss) • A range of codecs, bit rates, and simulated transmission errors are added to the reference. • The LIVE Image Quality set is focused on a wider set of distortions • Compression artefacts, Channel fading, white noise, blurring.
Test Environment • In any subjective test, special attention needs to be taken to the setup of the display and room. • ITU-R Rec. BT.500 have a series of recommendations
Test Environment • In VQEG, the tests were conducted in a number of different sites and each venue was required to carefully measure various aspects of the test environment. • Large number of Participants • For the LIVE databases much less was known about the test environment. • The classic “test in the lab” scenario. • Fixed small scale tests with a limited number of participants • Usually postgrads or undergrads, mostly male etc. • Sometimes tests will be done to assess visual acuity of the subjects.
Processing of Scores • Outlier Rejection • Before MOS/DMOS calculation various steps are taken to remove outliers from the data and remove test subjects whose scores deviated too far from standard behaviour • Calculation of DMOS values from raw opinion scores • For FRTV Phase 1 – DMOS values for each distorted sequence are calculated by averaging all of the opinion scores for that sequence • HDTV Phase 1 – DMOS score is estimated by calculating the difference between the MOS’s of the distorted and reference signals • The LIVE database first calculate a difference score for each distorted image/video and normalise the means and standard deviations of each user and also across sessions.
MOS v DMOS • MOS • An absolute score of quality (for benchmarking NR metrics) • A high value indicates a high subjective quality • The range of values depends on the test methodology. • DMOS • A relative measure of quality (for FR and RR metrics) • Usually a value of 0 indicates no perceptible difference and higher values indicate a loss of quality (like MSE). • The LIVE databases and FRTV Phase 1 all scale DMOS values between 0 and 100. • Negative values are possible (ie. Distorted image is ranked higher than the reference). Some databases treat this as an error condition.
Benchmarking of FR Objective Metrics • Every distorted image/video has a DMOS value associated. If we have an objective metric (MSE/PSNR) we can then calculate the metric value for each distorted signal by comparing it to the corresponding reference. • So for each distorted signal we have a pair of values where is the objective score for the ith signal and is the DMOS. • Plotting these pairs as points for each distorted image we will get a point cloud like the one on the right.
Benchmarking of FR Objective Metrics • The point cloud can be used to derive a predicted subjective DMOS (DMOSp) by fitting a curve to the data. • Each of the subjective studies we have looked at suggest a model for the curve. • LIVE and FRTV Phase 1 suggest models including a logistic curve. • HDTV uses a 3rd order polynomial.
Benchmarking of FR Objective Metrics A Graph of predicted against actual DMOS for the objective metric. If our metric was perfect the points would all lie on a straight line through the origin
Metrics for Measuring QA Performance • QA method Accuracy/Precision • How well does the predictive model fit the observed QA scores? • Pearson Linear Correlation between DMOS and DMOSpvalues. • RMSE between DMOS and DMOSpvalues. • Monotonicity • Does the objective metric rank the distorted sequences correctly? • Spearman Rank Correlation
Pearson Linear Correlation, where • and are the DMOSp and DMOS for the ith distorted image/video. • is the number of distorted sequences in the test set. • and represents the means and variances of the DMOSp and DMOS values. • is the covariance between the DMOSpand DMOS values.
Spearman Rank Correlation, The DMOSp/DMOS () pairs are converted into a ranked pair () where implies has the kthlowest DMOSp value etc. is then the Pearson coefficient of the ranked values
PSNR on FRTV Phase 1 and LIVE Image and Video Datasets LIVE Image Quality Database LIVE Video Quality Database Variations in PSNR values for the different databases can be due to The different content of each database The different test methodologies, The different ways DMOS scores are estimated. FRTV Phase 1 Database