Download
1 / 33
360 likes | 937 Views
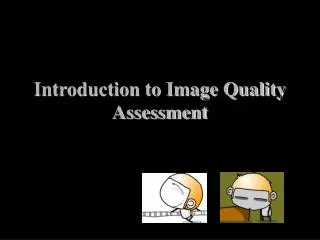
Introduction to Image Quality Assessment. Outline. Applications Image Quality Assessment Image Quality Assessment with Reference Image -Zhou Wang and Alan C. Bovik, ICASSP2002 Blind Image Quality Assessment -Xin Li, ICIP2002. Image Quality ?. Image Quality Assessment. Bad. Good.

E N D
Outline • Applications • Image Quality Assessment • Image Quality Assessment with Reference Image -Zhou Wang and Alan C. Bovik, ICASSP2002 • Blind Image Quality Assessment -Xin Li, ICIP2002
Image Quality Assessment Bad Good
Applications • Image Acquisition Systems and Display Systems • Image Processing Systems and Algorithms • Compression and Network
Image Quality Assessment • Mean Opinion Score • Automatically Image Quality Evaluation
Image Quality Assessment Methods • Image Quality Assessment with Reference Image • Blind Image Quality Assessment
Image Quality Assessment Methods • Image Quality Assessment with Reference Image • Blind Image Quality Assessment
Error Sensitivity Based Image Quality Measurement alignment, luminance transformation, and color transformation
Error Sensitivity Based Image Quality Measurement resulting in two sets of transformed signals for different channels
Error Sensitivity Based Image Quality Measurement The errors between the two signals in each channel are calculated and weighted, usually by a Contrast Sensitivity Function (CSF).
Error Sensitivity Based Image Quality Measurement The weighted error signals are adjusted by a visual masking effect model, which reflects the reduced visibility of errors presented on the background signal
Error Sensitivity Based Image Quality Measurement Minkowski error pooling
Weaknesses of Error Sensitivity Based Methods • The reference signal is of perfect quality • There exist visual channels in the HVS and the channel responses can be simulated by an appropriate set of channel transformations. • CSF variance and intra-channel masking effects are the dominant factors that affect the HVS’s perception on each transformed coefficient in each channel OK!
Weaknesses of Error Sensitivity Based Methods • For a single coefficient in each channel, after CSF weighting and masking, the relationship between the magnitude of the error and the distortion perceived by the HVS can be modeled as a non-linear function. • The interaction between channels is small enough to be ignored.
Weaknesses of Error Sensitivity Based Methods • The perceived image quality is determined in the early vision system. Higher level processes, such as feature extraction, pattern matching and cognitive understanding happening in the human brain, are less effective • Active visual processes, such as the change of fixation points and the adaptive adjustment of spatial resolution because of attention, are less effective
Structure Distortion Based ImageQuality Measurement • The main function of the human eyes is to extract structural information from the viewing field, and the human visual system is highly adapted for this purpose. Therefore, a measurement of structural distortion should be a good approximation of perceived image distortion
Structure Distortion Based ImageQuality Measurement loss of correlation, mean distortion, and variance distortion
Experimental Results a: original b: 0.9372 c: 0.3891 d: 0.6494 e: 0.3461 f: 0.2876
Image Quality Assessment Methods • Image Quality Assessment with Reference Image • Blind Image Quality Assessment
Blind Image Quality Assessment • Human visual system usually does not need any reference to determine the subjective quality of a target image • Distinction between fidelity and quality
Blind Image Quality Assessment • Edge Sharpness Level • Random Noise Level • Structured Noise Level
Random Noise Level • Impulse Noise • Additive White Gaussian Noise
Structured Noise Level • Block Artifact • Ringing Artifact
Blind Image Quality Assessment • Combination of different measurement is still a problem.
Conclusion • Image Quality Assessment with Reference Image • Blind Image Quality Assessment