Download
1 / 27
270 likes | 414 Views
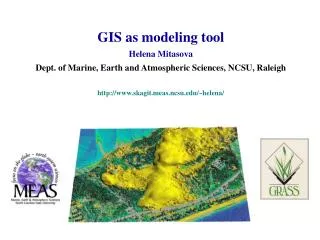
GRASS as multidimensional dynamic GIS: past vision and where we are now Helena Mitasova Department of Marine, Earth and Atmospheric Sciences , North Carolina State University, Raleigh, NC with contributions by: M. Neteler, ITC-irst, Trento, Italy

E N D
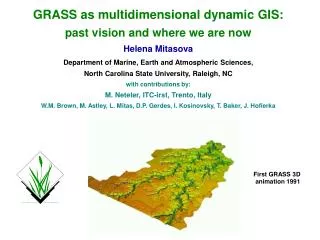
GRASS as multidimensional dynamic GIS: past vision and where we are now Helena Mitasova Department of Marine, Earth and Atmospheric Sciences, North Carolina State University, Raleigh, NC with contributions by: M. Neteler, ITC-irst, Trento, Italy W.M. Brown, M. Astley, L. Mitas, D.P. Gerdes, I. Kosinovsky, T. Baker, J. Hofierka First GRASS 3D animation 1991
What is GRASS • http://grass.itc.it General purpose GIS for geospatial data management, analysis, image processing, modeling, cartographic production and visualization (over 300 modules). Developed by US Army CERL 1982-1994 and released under GNU/GPL in 1999 with complete source code available: freedom to analyse, modify and distribute the software. Portable: runs on Linux, Mac OS X, other Unix platforms (32/64bit), MS-Windows/Cygwin. Managed by GRASS Development Team with the main site at ITC-irst, Trento Italy: Markus Neteler . CVS server and bug tracker provided by Intevation GmbH, Germany; distribution through 30+ mirror sites .
Open source geospatial software: http://freegis.org/ There is a wide range of projects besides GRASS, open source provides interoperability: GDAL (geospatial data abstraction library): data exchange 40+ raster formats, OGR is used for vector formats (shape, GML2,...) PROJ: cartographic projections (120+) MapServer: WebGIS R language: statistics, including geostatistics QGIS: Quantum GIS PostgreSQL/PostGIS H. Mitasova
GRASS6.0: new GUI for 2D display GIS Manager Map Display Module control Terminal
Visualization in GRASS - started in 1991 by Dave Gerdes team at CERL - SG3d (now retired): surface visualization for SGI - sg4d: added volume visualization,never released Nviz - 2D rasters as multiple surfaces (color, transparency) - 3D rasters as isosurfaces, crossections, volumes - 2D and 3D vector data: points, lines, areas - interactive lighting, cutting planes and query - keyframe animation and scripting H. Mitasova
NVIZ in GRASS6 H. Mitasova
Multiple surfaces used for terrain change analysis 3D NVIZ H. Mitasova
Modeling impact of land use change NVIZ H. Mitasova
Overland water flow NVIZ H. Mitasova
Elevation surface combined with 3D vector data NVIZ H. Mitasova
3D soil properties: soil textures at archeological site in South America sg4d 3D grid files interpolated by 3D interpolation s.surf.3d (s.vol.rst), displayed by sg4d as a solid volume representing buried old lava flow and crossections combined by cut-off topography H. Mitasova
New volumes in nviz implemented by Tomas Paudits, Bratislava H. Mitasova
Analysis of method Impact of tension on surface interpolated by s.surf.tps SG3d Concentration of chemicals measured at scattered points . Animation illustrates how the character of the resulting surface changes with changing tension from thin steel plate (low tension) to rubber sheet (high tension). H. Mitasova
Output from a simulationWater flow over complex terrain SG3d Animation illustrates a simple, kinematic wave overland water flow simulation for uniform rainfall, soil and cover conditions. Created by customized version of r.flow by writing output flowline densities after passing given number of cells. H. Mitasova
Output from a simulationSediment flow over complex terrain SG3d Combines series of kinematic wave overland flow surfaces with slope using r.mapcalc to illustrate simulation of sediment flow H. Mitasova
Viewing 3D data Soil horizons represented by multiple surfaces NVIZ Soil horizons represented by 2D raster maps interpolated from soil samples viewed as multiple surfaces using a moving cutting plane H. Mitasova
Output of simulation and analysis of method Path sampling method: multiscale flow simulations NVIZ Nested grid DEM visualized using multiple masked surfaces with evolving multiscale particles draped over them. Particles represent evolution of overland water flow : output of r.sim.water. H. Mitasova
Dynamic model from observations Monthly Nitrogen in Chesapeake Bay: one year cycle sg4d Animated series of 3D grid files interpolated by 4D interpolation s.surf.4d (s.volt.rst), displayed by sg4d. H. Mitasova
Dynamic model from observations Evolution of chemical concentrations in groundwater based on 10 years of well sample data sg4d Spatio-temporal distribution of chemical concentrations computed by interpolation from 10 year well data scattered in space and time using s.surf.4d (now s.volt.rst) H. Mitasova
Visualization of multiattribute, multidimensional point data SG3d 3D nitrogen data colored according to the predictive error of 4D RST interpolation Multiattribute soil texture data displayed using symbols sized and colored according to the attributes. Not all options in nviz. H. Mitasova
Globe SG3d not ported to NVIZ H. Mitasova
Future developments Data structures: - testing g3d library and 3D vector support, - support for massive data sets - storing large time series (HDF?, extend g3d?), Applications - testing/finishing existing 3D modules, - extending selected 2D modules to 3D, - coupling or integration of dynamic models, Visualization - release new navigation - add missing sg3d capabilities to Nviz : legends, scales, labels, multi-attribute site symbols, flowlines; - test and enhance volume visualization H. Mitasova
2D/3D SHAPE file -> v.external: registering map into GRASS without import only pseudo-topology, read-only; -> v.in.ogr: full import into GRASS, conversion to topological model, optional correction of topological errors, full topologyAlso: ArcCoverage, GML2, MapInfo, DGN, PostGIS etc are supported GRASS vector map -> v.out.ogr: Export to SHAPE, MapInfo, GML2, PostGIS etc.
GRASS 6 and PostgreSQL/PostGIS SQL based Spatial data types+ spatial operators PostgreSQL PostGIS GEOS Oracle Spatial Oracle Standard SQL types+ standard operators GRASS 6 (via OGR) PostgreSQL: standard SQL DBMS: object oriented relational DBMS PostGIS: extends PostgreSQL by spatial data types (POINT, LINESTRING, MULTIPOLYGON, ...), spatial operators (point in polygon etc), spatial indexes, and projection support GEOS - spatial predicate: The GEOS library provides support for exact topological tests such as Touches(), Contains(), Disjoint() and spatial operations such as Intersection(), Union() and Buffer()
GRASS 3D voxel volumes • Voxel: x,y,z cubes or 3D rectangulars • C API: doxygen documented (ANSI/POSIX) • Data exchange via 3D point data: ASCIIExport to ASCIIExport to Vis5D+ • 3D Interpolation - IDW - Regularized splines with tension and Cross Validation • 3D map algebra: calculating with/within voxels
Module/User Geometry Attribute Vector library DBMI library Native OGR PostgreSQL MySQL ODBC DBF PostGIS Files: GML2, SHAPE,Arc,... File MySQL File PostgreSQL Oracle u.a. GRASS 6 Vector architecture