Download
1 / 34
340 likes | 365 Views
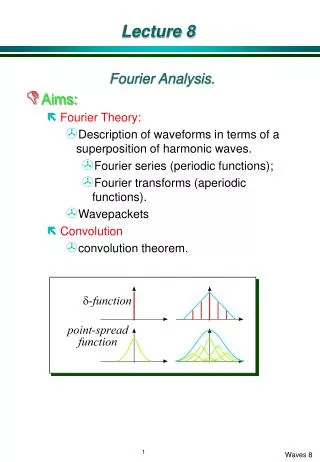
Lecture 8. Topics for today Derivation of the OLS estimators Assumptions of CLRM and Derivation of OLS estimates. Derivation of OLS estimators. Assumption of CLRM. Our objective is to estimate β1 and β2. The method of OLS discussed does this job.

E N D
Lecture 8 Topics for today • Derivation of the OLS estimators • Assumptions of CLRM and Derivation of OLS estimates
Assumption of CLRM • Our objective is to estimate β1 and β2. • The method of OLS discussed does this job. • We would like to know how close and are to their counterparts in the population or how close is to the true E(Y | Xi). • As dependent variable depends on regressors and error term. We must know how these are generated. • That is why we have to make assumptions about explanatory variables and the error term.
Assumptions…. 1- The model is Linear in parameters 2- X values are fixed in repeated sampling. Values taken by the regressor X are considered fixed in repeated samples. More technically, X is assumed to be nonstochastic. What this means is that our regression analysis is conditional regression analysis, that is, conditional on the given values of the regressor(s) Xi. 3:Zero mean value of disturbance Ui. Given the value of X, the mean, or expected, value of the random disturbance term Ui is zero. Technically, the conditional mean value of Ui is zero.Symbolically, we have
Assumptions… 4-Homoscedasticity or equal variance of error term. Given the value of X, the variance of Ui is the same for all observations. That is, the conditional variances of Ui are identical. Symbolically,
Assumptions… 5- No autocorrelation between the disturbances. Given any two X values, Xi and Xj (i not equal to j ), the correlation between any two Ui and Ujis zero. Symbolically, 6- Zero covariance between Ui and Xi , E(Ui, Xi) = 0.
Assumptions…. 7- The number of observations n must be greater than the number of parameters to be estimated. 8- The X values in a given sample must not all be the same. Technically, Var (X) must be a finite positive number. 9-The regression model is correctly specified. Alternatively, there is no specification bias or error in the model used in empirical analysis. 10- There is no perfect Multicollinearity.That is, there are no perfect linear relationships among the explanatory variables.
Are these assumption realistic? • It is worth million $ and old age question in the philosophy of science. • Some argue that reality does not matter it is the prediction that is made. • Assumptions help to build theory. • It make the understanding simple. • Latter we can check what happens if these assumption are not maintained. • All theories are based on some assumption. • Researcher must aware of these assumptions.
Precision or standard error of OLS estimates. • LSE are the function of the sample data • Estimates change as data changes from sample to sample. • Some measure of reliability or precision is needed. • In statistics precision of estimates is measured by Standard Error. • SE is nothing but the standard deviation of the sample distribution of the estimator. • Sampling distribution of an estimator is simply a probability distribution of the estimate- the set of values of the estimator obtained from all possible samples of the same size from a given population.
Features of the variances of and • The variance of is directly proportional to but inversely proportional to . That is, given the larger the variation in the X values, the smaller the variance of and hence the greater the precision with which can be estimated. • Also, given the larger the variance of , the larger the variance of • 2. The variance of is directly proportional to and but inversely proportional to and the sample size n. • 3. Since and are estimators, they will not only vary from sample to sample but in a given sample they are likely to be dependent on each other, this dependence being measured by the covariance between them.
Covariance of Estimates • After noting the formula from notes: • Var (βˆ2) is always positive, as is the variance of any variable, the nature of the covariance between βˆ1 and βˆ2 depends on the sign of X¯ . If X¯ is positive, then as the formula shows, the covariance will be negative. Thus, if the slope coefficient β2 is overestimated (i.e., the slope is too steep), the intercept coefficient β1 will be underestimated (i.e., the intercept will be too small). (loan example of negative mean) • How do the variances and standard errors of the estimated regression coefficients enable one to judge the reliability of these estimates? This is a problem in statistical inference.
Properties of OLS- Gauss Markov Theorem Gauss–Markov Theorem: Given the assumptions of the classical linear regression model, the least-squares estimators, in the class of unbiased linear estimators, have minimum variance, that is, they are BLUE. • We need to Know the BLUE property of the estimate. • An estimator, say the OLS estimator βˆ2, is said to be a best linear unbiased estimator (BLUE) of β2 if the following hold: 1. It is linear, that is, a linear function of a random variable, such as the dependent variable Y in the regression model. 2. It is unbiased, that is, its average or expected value, E(βˆ2), is equal to the true value, β2. 3. It has minimum variance in the class of all such linear unbiased estimators; an unbiased estimator with the least variance is known as an efficient estimator.
Graphical representation of G-M theorem • We assume, for convenience, that the distribution of in repeated sample is symmetrical. (Notes) • Also assume that is unbiesed.ie. Its expected value is equal to the true parameter. • Both parameter are linear. • is obtained by some other method. -the distribution of β*2 is more diffused or widespread around the mean value than the distribution of βˆ2. • In other words, the variance of β* 2 is larger than the variance of βˆ2 • Which is the best estimate? • one would choose the estimator with the smaller variance because it is more likely to be close to β2. • In short, one would choose the BLUEestimator. • Theorem is remarkable as it makes no assumption about error term. • If assumption of CLRM are satisfied the OLS estimators have the minimum variance. However, we will see that if some or any of the assumption is collapsed other estimators may perform better than OLS.
The coefficient of determination - a measurement of goodness of fit. • we shall find out how “well” the sample regression line fits the data. • If all the points are on the line it is perfect fit but it is impossible. Generally, there will be some positive ˆuiand some negative ˆui. • The coefficient of determination r 2 (two-variable case) or R2 (multiple regression) is a summary measure that tells how well the sample regression line fits the data. • We present Vann Diagram or Ballantine view. • Circle Y represents variation in the dependent variable Y and the circle X represents variation in the explanatory variable X. • The overlap of the two circles (the shaded area) indicates the extent to which the variation in Y is explained by the variation in X. (go to notes) • The r 2 is simply a numerical measure of this overlap
Computation of • See notes
Properties of • 1. It is a nonnegative quantity. (Why?) • 2. Its limits are 0 ≤ r ≤ 1. • An r 2 of 1 means a perfect fit, that is, Yˆi= Yi for each i. On the other hand, an r 2 of zero means that there is no relationship between the regressand and t regressor whatsoever (i.e., βˆ2 = 0). In this case shows, Yˆi= βˆ1 = Y¯, that is, the best prediction of any Y value is simply its mean value. In this situation therefore the regression line will be horizontal to the X axis.
Other formulas to estimate • Go to notes • Show the diagram after the different some of squares are estimated. • In notes red color diagram.
Properties of ………… • 5. If X and Y are statistically independent (see Appendix A for the definition), the correlation coefficient between them is zero; but if r = 0, it does not mean that two variables are independent. In other words, zero correlation does not necessarily imply independence. • 6. It is a measure of linear association or linear dependence only; it has no meaning for describing nonlinear relations. Thus in Figure 3.11(h), Y = X2 is an exact relationship yet r is zero. (Why?) • 7. Although it is a measure of linear association between two variables, it does not necessarily imply any cause-and-effect relationship. • In the regression context, r 2 is a more meaningful measure than r
One more formula to compute • See notes: