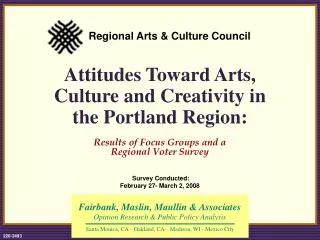
Methodology
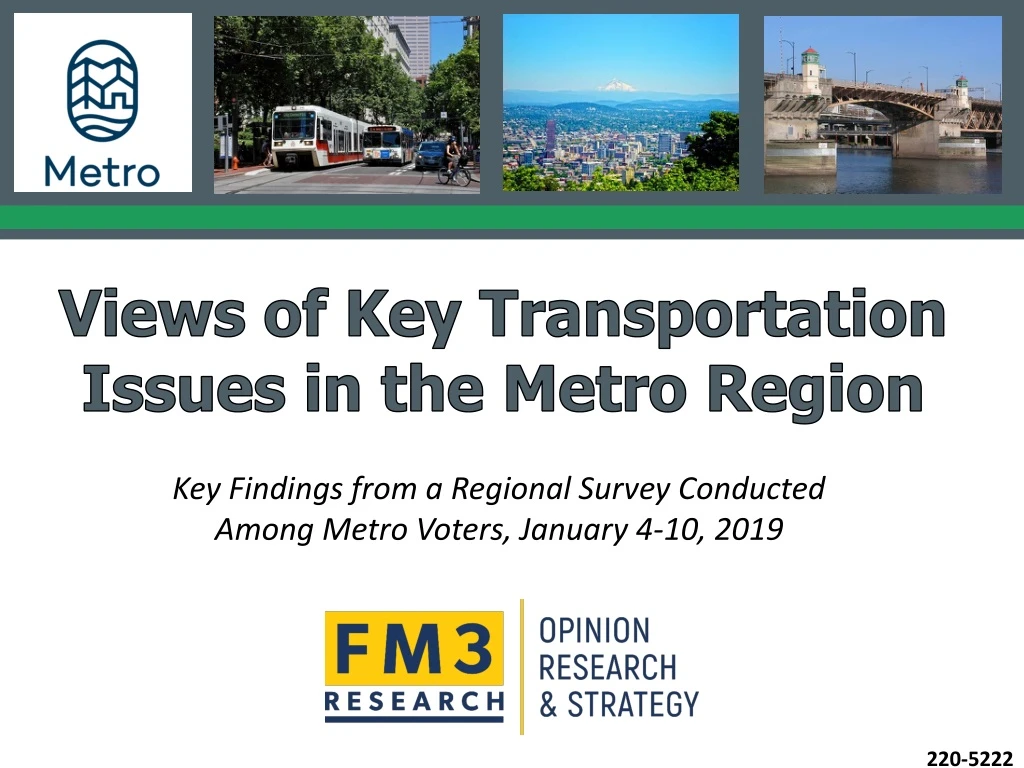
This survey examines the views of likely November 2020 voters in the Portland Metro area on various issues including the direction of the region, local government, organizations, problems, goals, and the rate of growth and development. The data was collected through interviews conducted in January 2019, both online and via landline and cell phones. The margin of sampling error is +/-2.8% at a 95% confidence interval. The data was statistically weighted to reflect the true geographic distribution of voters in the region.

Methodology
E N D
Presentation Transcript
Methodology • 1,463 interviews with likely November 2020 voters in the Metro service area • Conducted January 4-10, 2019, online and via landline and cell phones • Margin of sampling error of +/-2.8% at the 95% confidence interval • 463 interviews in Clackamas County with a margin of error of +/- 4.6% • 594 interviews in Multnomah County with a margin of error of +/- 5.1% • 406 interviews in Washington County with a margin of error of +/- 4.9% • Data statistically weighted to reflect the true geographic distribution of voters through the region • Due to rounding, some percentages do not add up to 100% • Selected comparisons to prior Metro surveys
Regional voters have adopted a more negative view of the direction of the region. Would you say things in the Portland area are generally headed in the right direction, or do you feel that they are pretty seriously on the wrong track? Q1.
Views of local government remain generally positive… I’m going to read a list of organizations. I would like you to tell me if you have a generally favorable or unfavorable opinion of that organization. Q2.
…and have been fairly stable over time as well. (Total Favorable) Q2 c-f. I’m going to read a list of organizations. I would like you to tell me if you have a generally favorable or unfavorable opinion of that organization.*2018 to 2019 Difference
Traffic and housing costs are major concerns. I’m going to read you a list of issues. Please tell me whether or not you think each one is an extremely serious, very serious, somewhat serious, or not a serious problem. Q3. ^Not Part of Split Sample
Lack of convenient public transportation and pedestrian and bike safety are relatively less urgent priorities. Q3. I’m going to read you a list of issues. Please tell me whether or not you think each one is an extremely serious, very serious, somewhat serious, or not a serious problem. ^Not Part of Split Sample
Traffic and housing costs have become much more intense concerns in the last four years. (% Extremely/Very Serious Problem) Q3. I’m going to read you a list of issues. Please tell me whether or not you think each one is an extremely serious, very serious, somewhat serious, or not a serious problem. ^Not Part of Split Sample *Wording Slightly Different in 2015
At the same time, voters still see urgency in improving a range of conditions in the region. I’m going to read you a list of goals that some people might have for greater Portland. Please tell me how important that goal is to you personally as you think about the future: is it extremely important, very important, somewhat important, or not important? Q4. ^Not Part of Split Sample
Public transit inspires the least intensity relative to these other priorities. Q4. I’m going to read you a list of goals that some people might have for greater Portland. Please tell me how important that goal is to you personally as you think about the future: is it extremely important, very important, somewhat important, or not important? ^Not Part of Split Sample
Shifts in priorities over the last four years have been relatively modest. (Extremely/Very Important) Q4. I’m going to read you a list of goals that some people might have for greater Portland. Please tell me how important that goal is to you personally as you think about the future: is it extremely important, very important, somewhat important, or not important? ^Not Part of Split Sample*Wording Slightly Different in Previous Survey
A majority feels growth and development are moving too fast. Do you think the rate of growth and development in your community is too fast, about right, or too slow? Too Fast52% Too Slow7% Q5.
This perception has held steady since 2017. 2019 2017 2015 Too Fast30% Too Fast51% Too Fast52% Too Slow8% Too Slow6% Too Slow7% Q5. Do you think the rate of growth and development in your community is too fast, about right, or too slow?
A majority in Clackamas County believes the pace of growth and development is about right. Rate of Growth by County Q5. Do you think the rate of growth and development in your community is too fast, about right, or too slow?
Women are more likely to say that growth and development are moving too quickly. Rate of Growth by Gender by Age Q5. Do you think the rate of growth and development in your community is too fast, about right, or too slow?
There is little difference in attitudes on this question by party. Rate of Growth by Party Q5. Do you think the rate of growth and development in your community is too fast, about right, or too slow?
Renters are slightly more likely to express intense concern about the rate of growth. Rate of Growth by Residence Q5. Do you think the rate of growth and development in your community is too fast, about right, or too slow?
Voters have no illusion that the rate of growth will change. Over the next several years, do you think that growth in greater Portland will continue at its current pace, or will it eventually slow down? Younger voters are slightly more likely to say they believe that growth will continue at its current pace, as are voters in Washington and Clackamas counties. Otherwise, demographic differences are minor. Q6.
Voters believe the impacts of growth are more negative… The Portland area has been growing steadily. Do you think this has been more positive or more negative for your community? Total Positive27% Total Negative44% Q7.
…reflecting more ambivalence than had been evident in recent years. 2019 2017 2015 TotalPositive59% TotalPositive 27% TotalPositive43% Total Negative35% Total Negative46% Total Negative44% Q7. The Portland area has been growing steadily. Do you think this has been more positive or more negative for your community?
Men under 50 are divided on the impacts of growth, while their female counterparts largely see it as more negative. Rate of Growth by Gender by Age Q7. The Portland area has been growing steadily. Do you think this has been more positive or more negative for your community?
A majority of Republicans says the impacts of growth are more negative than positive. Rate of Growth by Party Q7. The Portland area has been growing steadily. Do you think this has been more positive or more negative for your community?
A majority of renters sees the impact of growth as more negative than positive, with one-quarter calling it “very negative.” Rate of Growth by Residence Q7. The Portland area has been growing steadily. Do you think this has been more positive or more negative for your community?
There is little difference by county in perspectives on the impact of growth. Rate of Growth by County Q7. The Portland area has been growing steadily. Do you think this has been more positive or more negative for your community?
Most voters in the region drive alone as their main way of getting around. Do you regularly, that is at least two or three times per week, use any of the following modes of transportation? By that I mean for any purpose, including commuting to school or work, running errands, or recreation. Portlanders, younger voters and lower-income households are more likely to ride light rail and buses. Voters of color are more likely to ride light rail. Q18.
Voters are most concerned with commute traffic. I am going to read you a list of situations when you may find traffic to be a problem for you. Please tell me whether traffic in greater Portland is a major concern in that situation, a minor concern, or not at all a concern for you. Q8.
Concern about traffic centers on highways. I am going to read you a pair of statements about transportation in greater Portland. This includes all types of ways to get around, including driving, walking, biking, and public transit like MAX and TriMet. Choose the statement that comes closest to your opinion. OR Q9a.
Regional highways are a bigger issue than are local streets and roads. I am going to read you a pair of statements about transportation in greater Portland. This includes all types of ways to get around, including driving, walking, biking, and public transit like MAX and TriMet. Choose the statement that comes closest to your opinion. OR Q9b.
Voters – except in Multnomah County – favor a smaller number of large projects. I am going to read you a pair of statements about transportation in greater Portland. This includes all types of ways to get around, including driving, walking, biking, and public transit like MAX and TriMet. Choose the statement that comes closest to your opinion. OR Q9c.
By a narrow margin, voters favor improved bus service over MAX lines. Which of the following do you think is the better way to improve the transit system in greater Portland? Please choose one even if it is hard to decide. OR Q13.
Ballot Measure Concept Tested Suppose there were a measure on the ballot in the greater Portland area to reduce traffic congestion, create additional transportation choices for residents, and make it easier and safer to get around the region. It would fund specific traffic relief projects; repairs to local streets and roads; new light rail and rapid bus lines; and projects that make local streets and roads safer. The measure would increase local taxes for thirty years, subject to a community oversight committee and independent annual audits. Q10. In general, do you think you would vote yes or no on a measure of this type?
Nearly two-thirds of voters back a measure in concept, but support is soft. In general, do you think you would vote yes or no on a measure of this type? Total Yes64% Total No31% Q10.
Nearly three-quarters of Democrats and two-thirds of independents back the idea. By Party Q10. In general, do you think you would vote yes or no on a measure of this type?
Two-thirds also back the proposal in Multnomah and Washington counties, though that support is soft. By County Q10. In general, do you think you would vote yes or no on a measure of this type?
Women and younger voters are stronger supporters of a potential measure. By Gender and Age Q10. In general, do you think you would vote yes or no on a measure of this type?
White voters are slightly more likely to favor the proposal; moms are more supportive than dads or voters without children. By Ethnicity, Disability & Parent Status Q10. In general, do you think you would vote yes or no on a measure of this type?
Support is higher among those who use alternatives to driving alone than it is among those who only rely on their private car. By Transportation Mode Q10. In general, do you think you would vote yes or no on a measure of this type?
Three-quarters of higher-income households and renters support the proposal. By Household Income & Residence Q10. In general, do you think you would vote yes or no on a measure of this type?
Seismic repairs and safety improvements are high priorities to seven in ten or more. I am going to read you six major goals that might be pursued if additional funding for transportation were available in the greater Portland area. Please tell me how important the goal is to you: extremely important, very important, somewhat important, or not important at all. Improving pedestrian and overall safety on streets and roads with a history of crashes, and near senior centers, schools and places where a lot of people walk Q11.
Asked to rank their choices, a majority rank repairs first or second, with nearly half saying the same of widening roads and highways. Which of these six do you think should be the most important goal for additional transportation funding? Q12.
Willingness to pay, as a general principle, is quite high. Regardless of how the money were raised, would your household be willing to pay ___ in additional taxes to fund the kinds of transportation improvements I have been describing? Q15.
Offering voters additional information only slightly increases support for the ballot measure concept. Initial Vote After Messages Total Yes66% Total Yes64% Total No27% Total No31% Q10/Q17. In general, do you think you would vote yes or no on a measure of this type?
Segmenting the Electorate by Consistency of Support • Consistent Definitely Yes: Voters who consistently indicated they would definitely vote “yes” on the proposal. • Ever No:Voters who indicated they at any time that they would vote “no” on the proposal. • Swing: Voters who do not fall into any of the other categories – remaining consistently undecided, softly supportive, or switching positions between degrees of support and indecision. • The following slide shows demographic groups that disproportionately fall into one category or the other.