Download
1 / 7
70 likes | 202 Views
This overview traces the development of broadcast rating systems, starting with Archibald Crossley’s random phone surveys in 1929 to measure radio program popularity. Notable advancements include the introduction of cooperative ratings, Hooper ratings in the 1930s using coincidental telephone techniques, and the acquisition of Crossley’s methods by A.C. Nielsen in 1950. The evolution continues with various technologies like the Audimeter, PeopleMeter, and automated measurements, leading to sophisticated audience metrics and advertising strategies. As rating systems adapted to changing media landscapes, they provided crucial insights for broadcasters and advertisers alike. ###

E N D
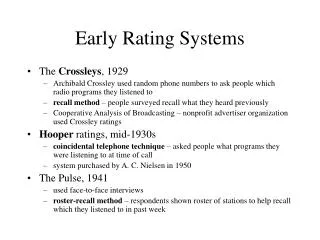
Early Rating Systems • The Crossleys, 1929 • Archibald Crossley used random phone numbers to ask people which radio programs they listened to • recall method – people surveyed recall what they heard previously • Cooperative Analysis of Broadcasting – nonprofit advertiser organization used Crossley ratings • Hooper ratings, mid-1930s • coincidental telephone technique – asked people what programs they were listening to at time of call • system purchased by A. C. Nielsen in 1950 • The Pulse, 1941 • used face-to-face interviews • roster-recall method – respondents shown roster of stations to help recall which they listened to in past week
Nielsen I • Conducted research for drug manufacturers, 1923 • Radio ratings • audimeter, 1936 – recorded which stations were tuned in on radios • National Radio Index, 1942 – sample of 1,000 homes • Television ratings • attached audimeter to TV sets in 1950 • by 1970, most connected to directly to central computer in Florida • some kept diaries to record which shows were watched by which members of family; recordimeter made sure diary entries were generally accurate • peoplemeter, 1987 – device that can record same information as audimeter and diaries • meters in development • active/passive meter – can determine whether people are in room • portable peoplemeter – pager-size device
Nielsen II • Information gathering techniques • random sampling – ideal households selected then chosen at random • usually multiple meters needed for each household • measuring base used to be households, but now individuals • attempts made to include out-of-home viewing • sample size now 50,000 households • Automated Measurement of Lineups, 1982 – keeps automated program schedule to determine which program is being watched • Analyzing information • Nielsen Television Index (NTI) – report on programs shown nationally • Nielsen Station Index (NSI), or sweeps – reports on local stations • country divided into more than 200 designated market areas (DMAs) • special reports – syndication, Hispanic viewing, VCR viewing, Internet
Arbitron • Measured TV and radio audiences, but dropped TV ratings in 1994 • Information gathering techniques • measures both metro survey area (MSA) and total survey area (TSA) • diaries sent to random sample of 1.3 million homes • printed reports sent to radio stations and advertisers • Purchased RADAR – system that tracks national radio programs with telephone recall method
Measurement Calculation • Rating • percentage of households watching TV program or listening to radio • considers total number of households owning TV set or radio • Share • also a percentage, but considers number of households with TV on • can total more than 100% as result of multiple sets in household • Gross average audience (GAA), or impressions – takes into account audience numbers if program is shown more than once in market • Average quarter-hour (AQ) – based on average number listening to station for at least 5 minutes during 15-minute period • Cume – number of different people who tune in over period of time • Percentages of people or households who have set tuned to anything • people using TV (PUT) and people using radio (PUR) • households using TV (HUT)
How Ratings Are Used • Selling advertising time – each prime time rating point worth about $30,000 • Advertisers use data to determine cost per thousand (CPM) and cost per point (CPP) • Determine overall health of industry • Basis of comparison – against competition and against the past • Programming decisions – programs rarely given chance to develop audience slowly
Other Forms of Feedback • Music preference research • sample usually taken from people already known to listen to station • phone or auditorium testing – researchers play music and ask participants prepared questions • focus groups – after hearing music, people discuss in small groups • Movies, TV programs, and commercials • pretesting – screening product before distribution • home testing on public access or UHF stations • Marketing Evaluation Inc. measures performer Q score for people and TVQ score for programs to determine popularity • Psychographics – lifestyle characteristics and how they relate to media preferences • Corporations and schools use effectiveness research