Census Data Capture with OCR Technology: Ghana’s Experience
190 likes | 384 Views
Census Data Capture with OCR Technology: Ghana’s Experience. Presented at the UNSD Regional Workshop on Census Data Processing Dar es Salaam, Tanzania 9 – 13 June, 2008 Presenter: K.B. Danso-Manu, Ghana Statistical Service. Ghana uses scanning technology for 2000 Census.

Census Data Capture with OCR Technology: Ghana’s Experience
E N D
Presentation Transcript
Census Data Capture with OCR Technology: Ghana’s Experience Presented at the UNSD Regional Workshop on Census Data Processing Dar es Salaam, Tanzania 9 – 13 June, 2008 Presenter: K.B. Danso-Manu, Ghana Statistical Service
Ghana uses scanning technology for 2000 Census • Ghana used the Optical Character Recognition (OCR) technology to capture the 2000 census forms. • Three Kodak 9500 document scanners used for 12 months. • About 4.5 million census forms captured. • Total population 18,912,079 persons. • Males = 9,357,382 males (49.5%). • Females = 9,554,697 females (50.5%).
Geographical Coding System • The 2000 Ghana census was conducted at the household level. • A 15-digit reference code was used to uniquely identify each household. • The hierarchical coding system used was as follows:
Capturing of census data Steps: • Office editing • Opening and preparation of forms • Scanning • Validation
Office Editing • The scanners could not recognize light crossed marks, responses had to be crossed again, deep enough for the scanner to recognize. • In rural scattered EAs, some enumerators gave the same locality (A06) code as that of the base locality. This had to be corrected before scanning. • Some enumerators used wrong EA codes for the questionnaire. • In many instances, after copying the codes, marking them on the questionnaires was done wrongly or not marked at all. • The front-page of some questionnaires especially supplementary forms was blank.
Opening and Preparation of Questionnaires for Scanning • After editing, questionnaires were opened, separated and prepared for scanning. • To ensure that the crosses were dark. • The 15-digit reference number was on the inner sheet with the household identification on the outer sheet (this was the only link the two forms had) for each household. • Continuation forms follow the original.
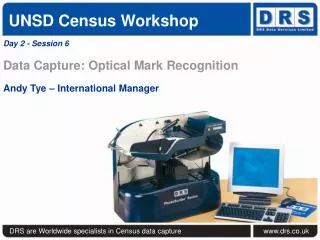
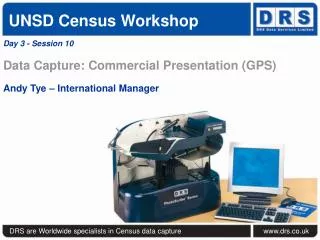
OCR Scanning • Type of scanners: Kodak 9500 D • Optical Resolution: 300 dpi • Speed: 120 ppm (A4) • Interface: SCSI-2 (8-bit) • Software: Readsoft’s Eyes & Hands
OCR Scanning (cont.) • The data capture involved scanning of the questionnaire, interpretation of the scanned marks, transfer of the data and loading the scanned data into an oracle database. • Periodic backups of the data and images were made on compact tapes – DLT Tapes 40GB.
OCR Scanning (cont.) • Three 8-hour shifts, 7 days a week for 4 months, then 6 days a week for 8 months. • Forms fed manually to avoid paper jams. • Forms scanned in batches of EA within districts and regions. • Scanned batch stamped, bagged and returned to the documents room.
Validation • Validation of scanned data was undertaken to correct structural and inconsistency problems identified in the dataset. • For every household that failed the structural and/or consistency checks, the image and dataset were recalled. • Necessary corrections made to the dataset but not the images.
Validation (cont.) • There was no direct mechanism to retrieve images of the questionnaires form tapes. • The validation process became very slow and tedious. • The validation teams worked the same shift as the scanning teams.
Difficulties and Challenges • Paper weight - different grammage of paper used to print the questionnaires (80g/m2, 100g/m2 and 120g/m2). - sheets got jammed up in the system. - Scanners fed manually.
Difficulties and Challenges (cont.) • No Barcodes on census forms • An 8-page questionnaire, consisting of two A3 sheets was used to design the OCR readable census questionnaire. • The company printing them could not print unique barcodes on them.
Difficulties and Challenges (cont.) • Number of scanners used • Three out of the six scanners planned for the data capture were purchased. • All three scanners were used to scan but became idle during interpretation and transfer of data.
Difficulties and Challenges (cont.) • Output from scanned questionnaires • The generated ASCII data file was all numeric and left justified. • Fields with 3 or 4-digit had their leading zeros truncated. • The scanners could not pick the 15-digit reference number correctly.
Difficulties and Challenges (cont.) • Power interruptions • Power fluctuations, power cuts and low voltage disturbed the flow of work to the extent that it sometimes became impossible to scan during the day. • This led to the destruction of two motherboards of the scanners and damage to a couple of computers and printers. • This problem was however resolved when a 100kVA generator and a stabilizer were installed.
Thank You … for your time and attention.