Download
1 / 23
230 likes | 383 Views
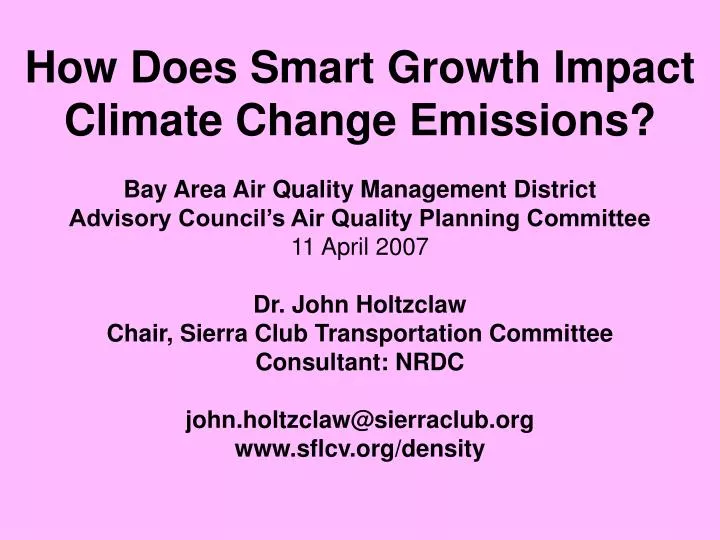
How Does Smart Growth Impact Climate Change Emissions? Bay Area Air Quality Management District Advisory Council’s Air Quality Planning Committee 11 April 2007 Dr. John Holtzclaw Chair, Sierra Club Transportation Committee Consultant: NRDC john.holtzclaw@sierraclub.org

E N D
How Does Smart Growth Impact Climate Change Emissions? Bay Area Air Quality Management District Advisory Council’s Air Quality Planning Committee 11 April 2007 Dr. John Holtzclaw Chair, Sierra Club Transportation Committee Consultant: NRDC john.holtzclaw@sierraclub.org www.sflcv.org/density
Community Transformationcourtesy Steve Price http://www.sierraclub.org/sprawl/community/transformations/index.asp Transform only main street - San Pablo Ave in El Cerrito, CA As ShownCensus Tract Avg. C T Before Transf. No Parking 60 hh/res ac 15 hh/res ac 9 hh/res ac Surface Parking 30 hh/res ac 12 hh/res ac 9 hh/res ac (census tract is 8 x 10 blocks)
San Francisco North Beach Paul and Tira 90 Hh/Res Acre Backyard, No parking
San Francisco - North Beach 90 Hh/Res Ac Underground parking
San Francisco West of Union Square 3 x 4 block zone 7 live theatres, fine hotels, cafes and markets 1 to 36 stories, mostly 4 - 16 stories 467 - 536 Hh/Res Ac 15% of land residential limited parking
San Francisco West of Union Square 3 x 4 block zone 7 live theatres, fine hotels, cafes and markets 1 to 36 stories, mostly 4 - 16 stories 467 - 536 Hh/Res Ac 15% of land residential limited parking
Ann lbs CO2 emissions/capita 14,827 903738631603 www.sflcv.org/density
Location Efficient Mortgage LEM research Institute for Location Efficiency Center for Neighborhood Technology (Chicago) Natural Resources Defense Council Surface Transportation Policy Project
LEM Research Nearly 3000 neighborhoods (TAZs) Chicago, LA and San Francisco metro areas How do: densities (3 measures) shopping proximity public transit ped/bike (grid, short, narrow, sidewalks, setbacks) family income family size impact: vehicles (census data) VMT (odometer readings from smog checks -- total driving, not just commutes)
Collateral Benefits of Compact Development Saving building materials, heating & cooling energy, and water cuts energy use and pollution (Phillips & Gnaizda, CoEvolution Quarterly, Summer 1980)
The Cool Cities Pledge, originally called the U.S. Mayors Climate Protection Agreement, states: . . . C. We will strive to meet or exceed Kyoto Protocol targets for reducing global warming pollution by taking actions in our own operations and communities such as: 1. Inventory global warming emissions . . . 2. Adopt and enforce land-use policies that reduce sprawl, preserve open space, and create compact, walkable urban communities; 3. Promote transportation options such as bicycle trails, commute trip reduction programs, incentives for car pooling and public transit; . . .