Download

1 / 33
330 likes | 442 Views
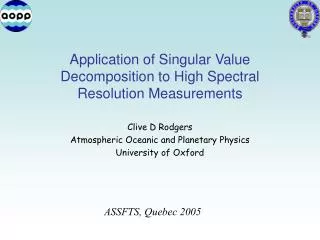
Application of Singular Value Decomposition to High Spectral Resolution Measurements. Clive D Rodgers Atmospheric Oceanic and Planetary Physics University of Oxford. ASSFTS, Quebec 2005. What is this about?. A spectrum has several thousand elements

E N D
Application of Singular Value Decomposition to High Spectral Resolution Measurements Clive D Rodgers Atmospheric Oceanic and Planetary Physics University of Oxford ASSFTS, Quebec 2005
What is this about? • A spectrum has several thousand elements • But only a few degrees of freedom for signal (ds) • Plus a lot of degrees of freedom for noise (dn) • We should be able to represent the useful signal in terms of a few coefficients • This can be done using singular vectors of a large ensemble of actual spectra
Acknowledgement • This will be an ill-digested description of a technique I’ve picked up from the AIRS community • They are using it to • Reduce noise in spectral data • Improve the efficiency of retrieval • Extract small signals from spectra • Data compression
Some Basic Philosophy • A measurement y is some known function f(x) of a ‘state’ x, plus measurement error ε • x includes all unknown quantities that affect the measurement • A retrieval r(y) is some way of finding a state xr such that f(xr) is consistent with y • This leads to a transfer function xr=t(x)=r(f(x)+ε)
Continued… • xr=t(x) can be linearised to relate the true state to the retrieval: xr = xa + A(x- xa) + Gε • Knowledge of A and Sε evaluated at xa fully characterises the retrieval • Errors are correlated • We can us SVD to find orthogonal functions of the state that have uncorrelated errors • But that isn’t what I want to talk about today…
What is the best estimate of a spectrum given a measurement? • This is related to • Image enhancement • Cleaning up noisy sound recordings • Forward model is ym=x + ε x is true spectrum, ym is measurement, ε is noise • Minimum variance estimate of x is xr = xa + Sa(Sa+Sε)-1(ym-xa)
Continued… • If we have a large sample of spectra: • Expect that xa= <x + ε> = <ym> • Can estimate Sa+Sε from statistics of ym • Should have a good idea of Sε • But Sa(Sa+Sε)-1 will be a large matrix, and Sa found from Sa+Sε and Sε is likely to be ill-conditioned • Sa is likely to have a ‘small’ number of eigenvalues greater than noise
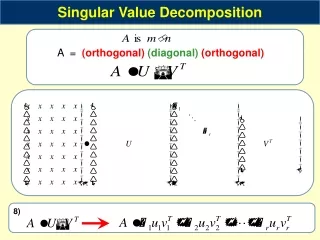
Singular Vectors(or Principal Components) • Let the ensemble of spectra be columns of a matrix Y • Represent Y as its singular vector decomposition: Y = UΛVT where Λ is diagonal, UTU=I and VTV=I • The j’th individual spectrum yj is then yj= ΣiuiλivijT • The spectrum is represented as a sum of columns ui of U, with coefficients λivijT. • Because UTU=I, we can compute λivijTforany spectrum as UTyj.
Example from TES • Run 2147, Sept 20-21 2004 • A set of nadir spectra • First 100 observations of the day • Each of 16 pixels, 1600 spectra in total • Filter 1B2, 923 to 1160 cm-1
What do we expect? • Singular vectors are the same as eigenvectors of YYT, singular values are the square roots of its eigenvalues • YYT is the covariance matrix of the spectra • In the linear case with independent constant noise, this would be Sy = KSaKT + σε2 I • KSaKT has rank ≤n, I is of dimension m >> n • Eigenvalues of Sy are λi2+ σε2 where λi2 are the eigenvalues of KSaKT
Reconstructing Spectra • We can drop terms with λi << σε without significant loss • they correspond to noise only • Better, multiply retained terms by something like λi2/(σε2+λi2) • So spectra can be reconstructed from the first few coefficients. • The noise can be reconstructed from the rest… • Reconstructed spectra have much reduced noise
Features • Most of variation is in the first singular vector. First six are: 5.96×10⁶ 3.6×10⁵ 1.83×10⁵ 1.39×10⁴ 7.93×10⁴ 6.16×10⁴ • Data spikes - identified • Data spikes - unidentified • Pixel-dependent variation in the spectra
Singular Vector 6 • Systematic variation across the detector array • Must be an artifact • Suggests systematic error in ILS • How is it related to mean spectrum? • Least squares fit to find function that when convolved with mean spectrum gives SV6
SV6 • Suggests the derivative of the ILS
What use is it? • Singular vectors • To some extent they separate out different sources of variability • Atmospheric quantities • Artifacts in the data • Reconstructed Spectra • Validation: you can see better what is going on • Identify artifacts • Retrieval from cleaner spectra • Reconstructed Noise • Noise characteristics - spectrum, correlations, etc • Artifacts
Precautions • Need a lot more spectra than I have used in this example • If retrieving from reconstructed spectra, you need to pay attention to error analysis and correlations: • the error in the reconstructed spectrum is correlated in channel number
Rough Error Analysis • Singular Vectors • Each vector is a combination of n (~1600) spectra • Each λu will have noise ~n-½ smaller • Reconstruction with p (~20) coefficients will have noise from this source ~(p/n)½ smaller from this source. • White noise, but correlated between spectra • Reconstruction coefficients • Each coefficient will have an error around m-½smaller than spectrum • Reconstruction will have noise ~(p/m)½ smaller from this source. • A random combination of singular vectors, so correlated spectrally
Retrieval from Reconstructed Spectra • The reconstructed spectrum has p (~20) degrees of freedom • Its error covariance has rank p, and is singular • A profile could in principle be retrieved from the p coefficients of the representation • if we had a forward model for the coefficients • The obvious model, to apply the singular vectors to the complete simulated spectrum, would be very expensive
However… • The spectrum could in principle be re-reconstructed from just p spectral elements • These p elements alone could be used to retrieve a profile • An automated microwindow/channel selection process should stop finding more information after p elements have been selected. • I havn’t tried this yet…
Conclusion This is a tool that I think is going to be very useful