Survival and Treatment Failure Analysis in Bile Duct and Gallbladder Carcinoma Patients
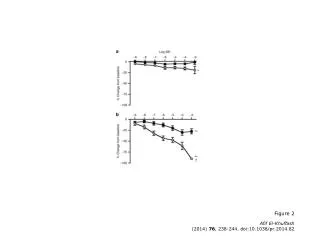
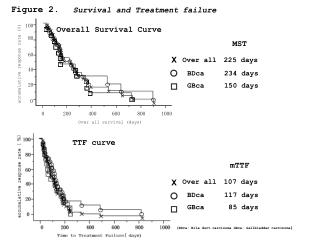
This study presents the overall survival and treatment failure curves for patients diagnosed with Bile Duct Carcinoma (BDca) and Gallbladder Carcinoma (GBca). Our analysis spans 225 days for overall TTF (Time to Treatment Failure) and 107 days specifically for BDca, with results demonstrating survival rates and failure probabilities (p = 0.4763 for BDca and p = 0.3014 for GBca). The findings highlight critical insights into treatment efficacy and patient prognosis, contributing to a deeper understanding of these malignant conditions.

Survival and Treatment Failure Analysis in Bile Duct and Gallbladder Carcinoma Patients
E N D
Presentation Transcript
mTTF MST Χ Over all225 days Over all107 days ○ BDca234 days BDca117 days p=0.4763 p=0.3014 □ GBca150 days GBca85 days Χ ○ □ Figure 2. Survival and Treatment failure Overall Survival Curve TTF curve (BDca: Bile duct carcinoma GBca: Gallbladder carcinoma)