Download

1 / 64
640 likes | 872 Views
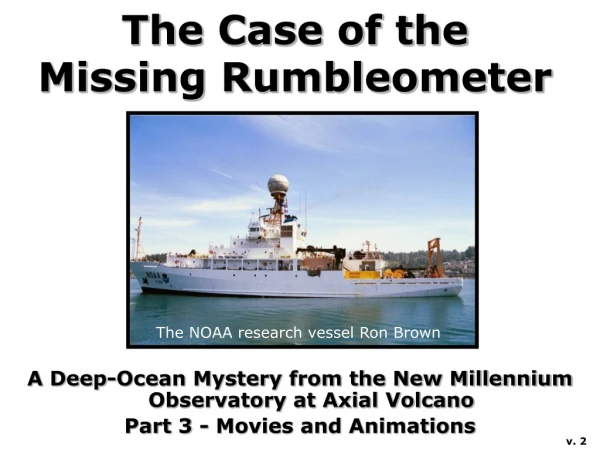
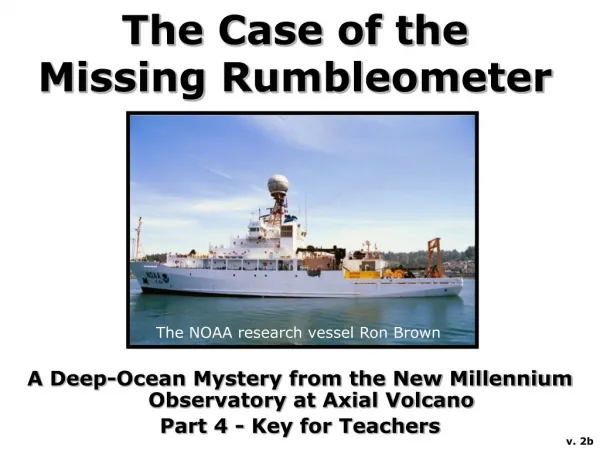
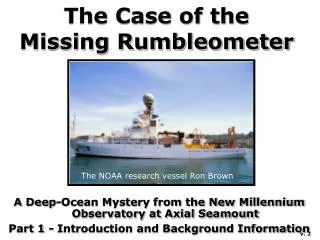
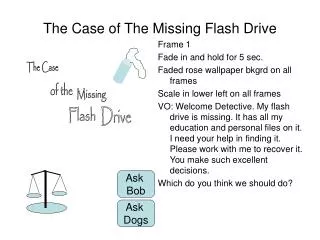
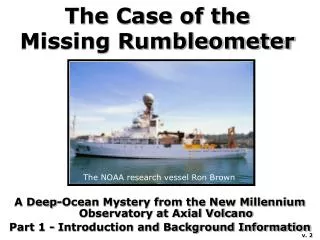
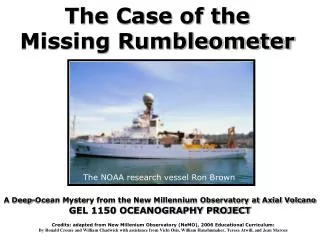
The Case of the Missing Rumbleometer. A Deep-Ocean Mystery from the New Millennium Observatory at Axial Volcano GEL 1150 OCEANOGRAPHY PROJECT. The NOAA research vessel Ron Brown. Credits: adapted from New Millenium Observatory (NeMO), 2006 Educational Curriculum:

E N D
The Case of the Missing Rumbleometer A Deep-Ocean Mystery from the New Millennium Observatory at Axial Volcano GEL 1150 OCEANOGRAPHY PROJECT The NOAA research vessel Ron Brown Credits: adapted from New Millenium Observatory (NeMO), 2006 Educational Curriculum: By Ronald Crouse and William Chadwick with assistance from Vicki Osis, William Hanshumaker, Teresa Atwill, and Jean Marcus
A Mystery to Solve Oblique view of the seafloor around Axial Volcano (white area near the center). In this computer generated image blue areas are deep and white are shallow. Several months ago, thousands of small earthquakes were detected at Axial Seamount, an active submarine volcano. This may mean that an eruption has occurred, but not necessarily. Your mission is to go to Axial Volcano and find out what happened there.
The Missing Rumbleometer Fortunately, a seafloor monitoring instrument, called a “rumbleometer” was already at Axial Volcano during the earthquakes and will provide important clues. But another ship was just out at the site and was not able to recover the rumbleometer. They could communicate with it on the bottom, so they know it is still on the seafloor, but they could not make it release and return to the surface. Why didn’t it return? Is it stuck on the bottom somehow? We really want to get the rumbleometer back because it likely recorded information on what the volcano was doing and will help us understand what happened during the earthquakes. We know where the rumbleometer is on the bottom, but you need to go out to Axial and find out why the rumbleometer did not come up. Then you need to recover it and look at the data it recorded to figure out what happened at Axial during the earthquakes. A research ship with a remotely operated vehicle are standing by ...
Glossary Acoustic: Pertaining to sound. Bathymetric map: A chart of ocean floor depths, similar to topographic maps on land. Caldera: A depression formed at the summit of a volcano caused by collapse when magma is removed from below. Chemosynthesis: The process by which microbes mediate chemical reactions to produce energy. This is in contrast to photosynthesis, because chemosynthesis does not require sunlight. Contour profile: A cross-section of topography along a given line. Degree: A unit of angular distance. There are 360 degrees in a circle (as on a compass). Deposit feeder: Animals that consume small pieces of plant and animal material that settle to the ocean floor from the water column. Epicenter: The point on the Earth's surface from which earthquake waves seem to radiate, located directly above the true center of the earthquake at depth. Earthquake swarm: A sequence of many small earthquakes (10’s to 1000’s), all of similar size (less than magnitude 4) and within a relatively short period of time (hours to weeks). Earthquake swarms are often recorded during volcanic activity. Hydrophone: An instrument used to record sound under water. Hydrothermal vent: A hot spring on the seafloor. Latitude: Angular distance on the Earth’s surface measured north or south of the equator. Lava: Molten rock after it has erupted from a volcano onto the Earth’s surface. Longitude: Angular distance on the surface of the Earth measured east or west from the prime meridian at Greenwich, England.
Magma: Molten rock that is underground, before it has erupted onto the Earth’s surface. Microbes: Single-celled living organisms, such as bacteria and archaea. Mid-ocean ridge: A type of tectonic plate boundary where two tectonic plates are moving apart (also called a “spreading center”). Volcanic activity creates a ridge along the boundary. Minute of latitude or longitude: A unit of angular distance that is 1/60 of a degree. Observatory: A site for long-term scientific observations. ROPOS: The name of the remotely operated vehicle usually used at NeMO. ROPOS stands for “Remotely Operated Platform for Ocean Science”. Rumbleometer: (pronounced rum-ble-om’-i-ter) A seafloor instrument that measures temperature and pressure (among other things) to help monitor submarine volcanoes. Seamount: An undersea mountain rising over 1000 meters above the surrounding seafloor. Seismometer: An instrument that detects ground movement from earthquakes. Sessile: Refers to marine animals that are permanently attached at the base; fixed in one place and unable to move around. Spreading center: See Mid-ocean ridge Subduction zone: A type of tectonic plate boundary where two tectonic plates are converging (moving toward each other) and one plate is forced under the other. Sulfide chimney: Formations made of sulfide minerals deposited directly from hydrothermal vent fluid at high-temperature seafloor hot springs. Symbiotic: The relationship of different organisms in a close association that is mutually beneficial. Many vent animals have symbiotic relationships with chemosynthetic microbes. Tectonic plates: Large intact pieces of the Earth’s outer rocky layer that move in relation to one another. Most of the Earth’s earthquakes and volcanoes are located near tectonic plate boundaries. Transform fault: A type of tectonic plate boundary where one plate slides past another. Triangulation: Method of finding a position with distances or angles from known points.
In order to solve the mystery of what happened to the rumbleometer during the recent earthquakes at Axial Volcano, you will conduct the following four activities: 1) Locate an earthquake epicenter - this will tell you where the action was and where to take the ship with ROPOS 2) Record observations during a ROPOS dive - you will look for clues on the seafloor in the area around the rumbleometer 3) Create before-and-after cross-sections of the seafloor - this mapping exercise will show if there have been any changes in seafloor depth since the previous survey was done before the earthquakes 4) Analyze data from the rumbleometer - pressure and temperature data recorded by the instrument will give important information about what happened OCEANOGRAPHY PROJECT
Grading • In order to get credit you must complete all 4 activities. • Print out all worksheets & complete them as instructed!
RUMBLEOMETER GRADING RUBRIC The Project consists of 5 individual segments. Each segment is graded on a 10 point grading system as indicate below. These raw points received will be added and then multiplied by three to derive at your final score. Raw Point Distribution per segment: ☐☐☐☐☐ ☐ ☐ ☐ ☐ ☐ 11 pts (A+), 10pts(A), 9pts (A-), 8pts (B), 7pts (C), 6pts (D), <6pts (F) Point deductions per segment: -1pt for every uncertainty, error, or incomplete; -1 to -3pts for quality BELOW other students in course Note: A+ (11pts) are given only for very exceptional & outstanding work rarely seen in a student project!
SEGMENT 1 Completed Project Overall Graded on Professionalism & Neatness Good (what I am looking for): including but not limited to folder, Cover sheet in front, Title page incl. Name, Class, Section, Date, Neatness, Business like print quality, Electronically prepared, ... Bad (point deductions): Cut n’ paste, missing Name on any or all of the parts, sloppy appearance, stains, handwritten, missing segments, out of order, etc....
SEGMENT 2 Locating Earthquake using Triangulation Graded on Triangulation Map & Hydrophone distance calculations Good (what I am looking for): table & calculations in Excel, map showing hydrophone Locations, distance circles, epicenter location, epicenter coordinates, etc.,... Bad (point deductions): Poor drawing; sloppy work; NO long.-lat. For epicenter, wrong location, missing circles, etc.....
SEGMENT 3 Ocean Floor Traverse Graded on Correctness & Completeness Good (what I am looking for): Excel Table addressing the following questions: Old or new lava? Lava collapsed or uncollapsed? Hydrothermal Vent present: Old or New? List of observed animal species ... Note: Best to transcribe the table presented in the power point into Excel Bad (point deductions): including but not limited to missing or sloppy / unprofessional work, not Excel, not enough detail, NOT observed, etc...
SEGMENT 4 Contour Profiling& Map Create five (5) contour profiles using the Contour Profile Worksheets presented in this Power Point. Can be hand drawn if neat AND orderly. Mark & shade the POST-event profile in Red. Post-event Map:Mark east and west boundaries of new lava flow in red on map roughly following the contour lines, to define boundary and extent of new lava flow Graded on drawing neatness, correctness, completeness Good (what I am looking for): including but not limited to clean cross section and map, ALL 5 sections present, NO errors, color coded differentiating between pre and post event, relying on data... Bad (point deductions): including but not limited to missing or sloppy work, incomplete data or map, no color coding, illogical compilation, etc. etc....
SEGMENT 5 Rumbleometer Data & Conclusion After plotting data electronically, type a concluding paragraph explaining what happened to the Missing Rumbleometer drawing on ALL the activities. Note: The questions presented throughout the exercises will help you to draw the proper conclusion in your write-up. It is NOT necessary to answer each question individually! Graded on use of Excel, Quality, Neatness, Language Good (what I am looking for): Excel data graphs, professional write-up, logical explanation using ALL the data, detailed, etc... Bad (point deductions): including but not limited to missing or sloppy / unprofessional work, hand-drawn, poor grammar / composition, etc....
Activity #1: Locating an earthquake using triangulation Earthquakes that occur at volcanoes are usually small and numerous. In fact, most of the earthquakes at Axial were too small to be detected by seismometers on land. Instead, scientists use hydrophones (underwater microphones) to detect submarine earthquakes. The hydrophones listen for the faint rumbling sounds that the earthquakes emit into the ocean. Several hydrophones have previously been positioned at Axial Volcano and we have been able to get the data they recorded during the earthquake swarm. A hydrophone being recovered at sea.
Oceanic earthquakes Diagram showing how part of the energy from a seafloor earthquake is converted into sound that travels through the ocean (as a T-wave). Oceanic earthquakes are detected more easily by hydrophones that by seismometers on land.
Calculating Distance Your first job is to determine the exact location of the earthquakes so we know where to take the ship and where to make our first dive with ROPOS. Thousands of earthquakes were detected, but we will just locate the one that was the largest. To do that, we must calculate the distance of the event from each hydrophone.The distance from each hydrophone to the earthquake's epicenter is determined by multiplying the time in seconds that the sound travels by its speed underwater. Distance = Time X Speed In this case, we can use a sound speed of 1.5 kilometers per second.
For Example: • If the sound of an earthquake takes 2 seconds to reach a hydrophone, we multiply that by the sound’s speed underwater to get the distance. • 2 seconds X 1.5 kilometers/second = 3 kilometers (Time X Speed = Distance) • The epicenter is, therefore, 3 kilometers from the hydrophone. • But note that it could be in any direction!
Marking the distance from a Hydrophone • Begin by calculating the earthquake’s distance from one hydrophone. • Using a compass, draw a circle on your map around the hydrophone’s location with a radius equal to the distance from the earthquake (as determined from the map’s scale bar). Hydrophone #1
Triangulation In order to pinpoint the exact location of the earthquake’s epicenter, we must determine the distance from at least three hydrophones. At the intersection of the three circles is the epicenter. Hydrophone #1 Epicenter Hydrophone #2 Hydrophone #3
Bathymetric Map On the following page you will find a large format black and white bathymetric map of the summit caldera of Axial Volcano. The black squiggly lines are contours of equal depth (at a 10 meter interval). Print it out to use as a worksheet for the triangulation activity. It can also be enlarged and printed on 11” x 17” sized paper. Color bathymetric map of Axial caldera (blue is deepest, red is shallowest).
Latitude and Longitude Geographic locations on a map are expressed in latitude (the north-south axis) and longitude (the east-west axis). Both latitude and longitude are measured in degrees (˚) and minutes (’). There are 60 minutes in one degree, and each minute can be further divided into tenths. For example, the location of “Fissure Cone” on the map of Axial caldera (at right) is approximately: 45˚ 58.6’ / -130˚ 01.8’ Fissure Cone
Hydrophone Locations Three hydrophones have been deployed near the southern edge of Axial caldera. These are the hydrophones that recorded location data on the earthquake. Accurately mark their locations on your map with the appropriate hydrophone number. #AX01 45˚ 55.0’ / -130˚ 01.0’ #AX02 45˚ 55.0’ / -129˚ 59.0’ #AX03 45˚ 57.0’ / -129˚ 59.0’
Locating the Epicenter Using the method of triangulation previously described, convert the earthquake sound travel times listed below into a distance from each hydrophone. Using a compass, draw a circle at the appropriate distance around each hydrophone and find the location of the earthquake epicenter. Remember: Distance = Time x Speed Use a sound speed of 1.5 km/second. #AX01 1.87 seconds #AX02 0.97 seconds #AX03 1.53 seconds What are the coordinates of the earthquake epicenter?
Activity #2: Ocean Floor Traverse Interesting ... the location of the earthquake’s epicenter is very near the location of the rumbleometer at Axial Volcano. Your task now is to take the ship to this location, find the rumbleometer, figure out why it is stuck on the bottom, then recover it and examine the data it recorded. The rumbleometer has sensors to measure small changes in temperature and pressure. This information will help you interpret what happened. The rumbleometer instrument as it appeared when it was being deployed from a ship. Note that the instrument frame has three legs that are each a half a meter long.
Dive to the seafloor with ROPOS OK, the ship is on site. You need to get ready to make a survey of the bottom with ROPOS to determine what happened to the rumbleometer. During this dive, ROPOS will travel in a straight line, from east to west, along 45˚ 55.8' latitude. You will make observations at eight points along the traverse. At each point, you need to locate your position on a map and record your observations on a worksheet. The remotely operated vehicle ROPOS getting ready to make a dive.
Bathymetric Map PRE-EVENT BATHYMETRIC MAP Here is a detailed bathymetric map of the rumbleometer area. ROPOS collected the data to make this map during an earlier expedition, before the earthquake swarm. The rumbleometer is located at the red dot at the center of the map. A larger version of this map is on the following page. It can be printed out on standard 8.5" x 11" paper.
Distinguishing old from new lava During the traverse, you will want to look for new lava. New lava is generally shiny and black and has not yet been covered with much sediment. New lava flows also do not have any deep-sea animals living on them except at hydrothermal vents where fast-colonizing animals, such as tubeworms, scaleworms, snails, and limpets can begin to colonize within a few months of an eruption.
Seafloor animals can tell a story The animals found living on the seafloor are very helpful for distinguishing new from old lava flows. Sessile (non-moving) and slow-colonizing animals like sponges, seafans, and crinoids are only found on old lava away from hydrothermal vents. Hydrothermal vents can be colonized quickly. Newly colonized hydrothermal vents (on new lava) typically have few species and individuals, and tubeworms are white and small (<50 cm), if present. Older established vents (on old lava) have more species and animals, and the tubeworms are brown and larger (>50 cm). Octopuses, crabs, and fish are mobile and can be found on either old or new lava.
Characteristics of deep-sea animal species (Print this sheet out and refer to it during the bottom traverse)
Submarine lava flows often have areas of collapse in the middle of the flows. At the edges of collapsed areas "lava pillars" are often present. If you see lava pillars on your bottom traverse with ROPOS, you know you are in the middle of a collapsed lava flow. Lava pillars and collapse areas Lava pillars in the middle of a collapsed part of a submarine lava flow.
Questions for the ROPOS dive Print out the worksheet on the following page and as ROPOS travels to each of the eight sites on your traverse, use the worksheet to write down your observations about the lava you see and the animal species that are living on it. Try to determine at each site: * Is there evidence for a recent eruption of lava here? * Is the lava collapsed or uncollapsed? * Is there a hydrothermal vent present, and if so, is it old or new? * What animal species are present and what do they tell you about the age of the lava? * Finally, what do the clues you see about lava age tell you about what happened to the rumbleometer?
Ocean Floor Traverse Worksheet What happened to the rumbleometer?
Begin Ocean Floor Traverse The remotely operated vehicle ROPOS enters the water. OK, you’re ready to make the ROPOS dive. Let’s see what the bottom looks like around the rumbleometer and see if we can figure out why the rumbleometer is stuck...
End of bottom traverse with ROPOS What are your observations and interpretations? Was new lava erupted in this area during the earthquake swarm? If so, where? What ideas do you have about what happened to the missing rumbleometer? (Hint: when it was originally deployed it was sitting on old lava, and you could see its three legs. Is that the case now?) You will find more clues in Activities #3 and #4.
Next, by maneuvering ROPOS back and forth in a grid pattern, we can produce a new bathymetric map of the area to look for changes in the seafloor terrain. Through a technique called contour profiling, we can create cross-section profiles of the seafloor along a given line. By comparing PRE- and POST-event contour profiles we can determine the extent of the new lava, its depth, and identify the collapsed areas. This will give more clues about what happened to the rumbleometer. Activity #3: Contour Profiling Map showing ROPOS tracklines.
POST-EVENT BATHYMETRIC MAP ROPOS collected data during your dive to produce a POST-event bathymetric map covering the same region as the PRE-event map. On the following pages, you will find printable versions of the POST-event map and the contour profile worksheet. You will need a copy of each map, PRE- and POST-, and one contour profile worksheet for each profile you plan to make (there are five). You will also need a black and a red pencil and a ruler or straight edge. CONTOUR PROFILE WORKSHEET
POST-EVENT BATHYMETRIC MAP Notice that the axes are different for the two maps (PRE and POST) and the contour profile worksheet. The maps have latitude on the vertical y-axis, whereas the worksheet has depth on the y-axis. Both the maps and the worksheet have longitude on the horizontal x-axis and they are the same size so that they can be overlain on each other. We are going to transfer depth information from the maps along a single east-west line of latitude onto a vertical cross section on the profile worksheet to look for changes in depth due to the lava eruption. CONTOUR PROFILE WORKSHEET
POST-EVENT BATHYMETRIC MAP Profile #1 Profile #2 Profile #3 Profile #4 Profile #5 Each contour profile will be made along a specific line of latitude on the PRE- and POST-event maps.