Download
1 / 37
370 likes | 552 Views
Light & the Electromagnetic Spectrum. Messenger from the Universe. Understand light’s nature Learn its language – what it can tell us about its source. (1) Speed of Light. Light travels damn fast…. Speed first measured by Ole Roemer (1675). Modern value : c = 300,000 km s -1

E N D
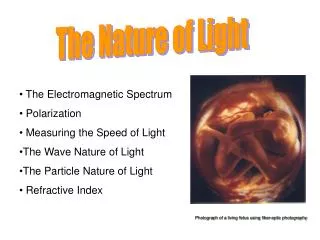
Messenger from the Universe • Understand light’s nature • Learn its language – what it can tell us about its source.
(1) Speed of Light Light travels damn fast…. Speed first measured by Ole Roemer (1675) Modern value : c = 300,000 km s-1 = 3 x 10⁸ m s-1
(2) Nature of Color Newton used a prism to find that white light contains a rainbow of colors (ROYGBV)
(3) Light as waves a) Huygens argued light is a wave Waves spread out = diffraction Incoming waves Blurring spread Newton thought light was a particle : “corpuscular”
λ Wavelength, λ b) Thomas Young measured its wavelength using two slit interference pattern λ Multiple fringes c) Light’s wavelength is very small: redblue 400700 nm 4000 7000Å [roughly cell-sized]
(4) Waves of what? Maxwell (1860) studied electric & magnetic fields Derived four equations: Predicted E-M waves of Velocity c=300,000 km s-1 Light is an EM wave !!
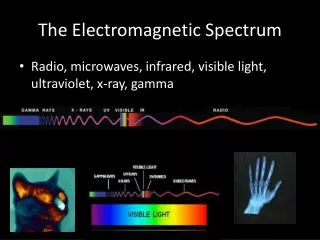
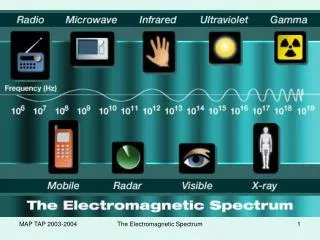
(5) Other wavelengths Over the next ~100 years, e-m waves of differentλ discovered radio Astronomers now use the entire electromagnetic spectrum here are some examples of non-visual images
Infrared Ultraviolet X-ray Telescopes
Need satellites to observe airplanes (6) Atmospheric Windows Parts of the em-spectrum are blocked by our atmosphere
(7) Frequency & the wave equation Frequency, f = number of waves passing any point per second. l c = 300,000 km/s = 3*108 m/s c = f l Since f waves each of length λ pass in 1 sec, we have
Em-waves often have very large frequencies : The wave equation also reads f = c/λ recall: c is huge and λ is tiny f is gynormous Example: what is frequency of green light, λ = 500 nm : f = 3 x 10⁸ / 500 x 10-9 = 6 x 10¹⁴ Hz = 6 hundred thousand billion oscillations per second Notice: the units of f are Hz (Hertz) = # per sec; (s-1) Recall: for radio, one often encounters MHz or GHz
Wavelength (m) Frequency (Hz) f and l are equivalent measures for an em-wave wavelength radio 1020 1018 1016 1014 1012 1010 108 106
(8) Light as particles = photons Einstein (1905) explained the photoelectric effect: Photons of light have energy proportional to frequency E = h f = hc / λ h = Planck’s constant = 6.6 x 10⁻³⁴ J s (Joules x seconds) Photon energies are very small e.g. red light : f=5 x 10¹⁴ Hz Ered = 6.6 x 10-34 x 5 x 1014 = 3 x 10-19 J Flashlight of 30 Watt (= 30 J/s) emits : 30/3x10-19 = 1020 photons/s = 100 billion billion per sec.
(9) Waves and/or particles? Is light a wave or a particle ? It has properties of both – one might say it is a “wav-icle” A wave packet : localized bundle of waves “Particles” also behave like waves e.g. protons & electrons will diffract and interfere In modern (quantum) physics, everything behaves this way. (more massive things are more particle-like – eg a football)
When a chargeaccelerates (changes speed &/or direction) – + b) When electrons jump between orbits within atoms e- (10) Creation of Light Two basic ways light is created :
Temperature scales: Kelvin scale: 0 K = zero motion “size” same as centigrade [ K = C + 273 ] 100 Kelvin degrees (11) Thermal energy & temperature What does it mean to say something is “hot” Molecules/atoms are in constant jostling motion : qualitatively: hotter faster motion quantitatively: T proportional to < KEpcle> (average kinetic energy per particle)
(12) Thermal Radiation Bouncing molecules photons Spread of energies range of colors Higher energy bounce bluer photons Pure creation of light also means pure absorption of light. In this case pure black This gives “Black Body Spectrum” = pure “thermal spectrum” = unique spectral shape depends only on temperature. Stars approximate thermal spectra
(13) Two Characteristics (a) Hotter objects curve moves to blue Wein’s Law : λpeak(nm) = 3x10⁶ / T(K) (b) Hotter objects more photons made Stefan-Boltzmann Law : E = σ T4 E in Watt per square meter T in Kelvin σ is Stefan’s constant = 5.7 x 10⁻⁸ Human: 300K 10 µm thermal emission
Atoms are tiny ~ 10-10 m (b) Nucleus much smaller ~ 10-5 atom contains 99.95% of the mass; +ve charge (d) # neutrons defines isotope : e.g. C12 : 6p6n ; C13 : 6p7n ; C14 : 6p8n (14) Atoms & Particles We need to understand these for two reasons : (i) electrons jumping colors/light diagnostics (ii) nuclei combing powers stars makes elements (c) # protons defines element : 1:H, 2:He, 3:Li, …. 6:C, 7:N,…. 26:Fe, …. 92:U
Cosmic abundances for all isotopes of all elements (relative to Si = 106) α elements Iron peak “rare” earths “light” elements Au
(f) Orbits since e- attracts nucleus+ & e’s less massive than nucleus (analogous to earth orbiting sun) However, not all orbits are possible: must have whole number of waves. 1,2,3 waves shells 1,2,3 e’s fit in nested shells, fill inner (lowest energy) ones first. } e’s orbits nucleus (e) Electrons : 1/2000 mass of p,n ; –ve charge if #e = #p neutral atoms if #e ≠ #p charged ions (usually fewer e)
Three types of spectra: consider also graphs of spectra – not just bars Continuous Emission Line Absorption Line
Electron ejected, photo-ionization (15) Light Atom interactions Photons interact quite strongly with electrons in atoms • electron jumps down photon emitted • electron jumps up photon absorbed 4 Energy of photon = energy difference between orbits Ephoton= hf = hc/λ = E4– E3 3 2 1 Single colors emitted/absorbed Color set depends on orbit set Different for each atom. c) electron ejected(ionization) energetic photon absorbed
Emission line spectra from specific atoms The specific set of lines is unique to each atom. It is like a “bar-code” identifier, or a fingerprint.
(16) Hydrogen Atom & its Spectrum Atomic orbits are often redrawn as energy level diagrams Bohr orbit figure Energy level diagram 5 4 3 2 1 0.0 Hydrogen spectra are particularly simple Several line series: Lyman (UV); Balmer (optical); Paschen (IR)……
Hydrogen Spectrum UV Lyman Visible Balmer Infrared Paschen wavelength 1st three lines of the Balmer series Hα , Hβ , Hγ , Nebulae often appear pink due to strong Balmer Hα emission at 656nm from the hydrogen gas.
Continuous spectrum : hot solid or dense gas Emission spectrum : hot rarefied gas Absorption spectrum : Continuous source seen through hot thin gas (17) Kirchoff’s Laws Define conditions for the formation of spectra
Hot dense gas below a cooler thin gas (atmosphere) The Sun’s Spectrum has many absorption lines Two representations of an absorption line spectrum showing three Balmer lines of hydrogen. Star spectra have absorption lines
Balmer lines are weak in v. hot stars all hydrogen is ionized Balmer lines are weak in v. cool stars need electrons in n=2 level Sequence of line strengths ionized He neutral He hyd. Balmer ionized “metals” neutral “metals” molecules. v. hot ~ 20,000K O B A F G K M “cool” ~ 3000K (18) Absorption line strengths The strength of an absorption line depends mainly on temperature
(19) Spectral sequence Oh Be A Fine Girl/Guy Kiss Me
(20) Abundance analysis Absorption line strength depends on temperature and abundance– how much element is present Possible to measure/calculate relative abundances : ~all stars have ~74% Hydrogen ~24% Helium ~2% all others (Star surfaces, not interiors).
(21) Doppler Shifts: velocity Moving light source changes apparent wavelength: Towards/away blue/red shift Only radial velocity component, Vr , affects wavelength Vr/c = (λ – λ0)/ λ0 Binary star in orbit
(22) Line widths: gas pressure Some stars have wider lines than others. Higher gas pressure blurs the atom energy levels gives broader line. Dwarf stars compressed atmosphere broad lines Giant stars fluffy low pressure atmosphere narrow lines E E High pressure Broad line Low pressure Narrow line