Download
1 / 13
130 likes | 232 Views
Explore a simple convection model creating chaotic rain downbursts. Air particles move within a grid, forming raindrops and snowflakes. The model exhibits thunderstorm features.

E N D
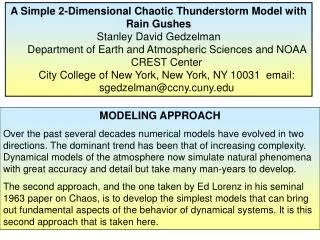
A Simple 2-Dimensional Chaotic Thunderstorm Model with Rain Gushes • Stanley David Gedzelman • Department of Earth and Atmospheric Sciences and NOAA CREST Center • City College of New York, New York, NY 10031 email: sgedzelman@ccny.cuny.edu MODELING APPROACH Over the past several decades numerical models have evolved in two directions. The dominant trend has been that of increasing complexity. Dynamical models of the atmosphere now simulate natural phenomena with great accuracy and detail but take many man-years to develop. The second approach, and the one taken by Ed Lorenz in his seminal 1963 paper on Chaos, is to develop the simplest models that can bring out fundamental aspects of the behavior of dynamical systems. It is this second approach that is taken here.
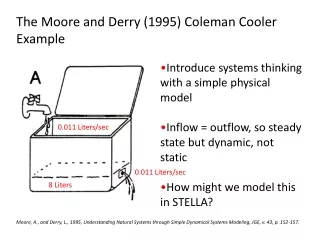
INSPIRATION AND MOTIVATION The idea to create a simplified thunderstorm model using a relatively small number of air particles and hydrometeors in place of the complicated partial differential equations and numerical mathematics was inspired by watching the motions of weightless tracer particles in the video, Study of a Numerically Modeled Severe Storm (Wilhelmson et al, 1990). The same tracer particles were shown to the world in the movie, Twister. As soon as the simplified model began running, it produced episodic (chaotic) downbursts with rain gushes. The complex behavior of the simulations surprised the author. Perhaps it should not have been so surprising considering that even simple convection models exhibit chaotic behavior. After all, Lorenz’s (1963) initial formulation of chaos was based on a simplified set of 3 equations representing nonlinear thermal convection.
DESCRIPTION AND RESULTS • A simple, 2-D model of convection that produces episodic (chaotic) downbursts with rain gushes is presented. Air particles (black dots) enter a grid at lower left with constant horizontal velocity towards the right and a small random initial vertical velocity. The grid consists of an unstably stratified troposphere and stably stratified stratosphere, each with fixed lapse rates. The air particles cool dry adiabatically below the condensation level and moist adiabatically above it. Individual raindrops (green circles) and/or snowflakes (purple circles) form above the condensation level and fall at prescribed terminal velocities. Evaporation is not included. • At every time step the vertical velocity and temperature of each air particle are calculated using Newton’s Second Law with buoyancy. Particle vertical velocities and temperatures in each box are averaged and the mass of condensate is calculated. Averaging mimics fluid behavior and so, bypasses the need for partial differential equations and complex advection schemes. Air particles that leave the grid at right or at bottom are recycled as new particles at lower left. • The model exhibits complex behavior with common thunderstorm features that include, • An overshooting top • An anvil extending downwind at the tropopause with stable buoyancy oscillations. • A narrow region of heavy convective rain • Episodic (chaotic) downbursts with rain gushes. • A separate, wide region of light stratiform rain further downwind.
ILLUSTRATIONS OF MODEL OUTPUT First Slide: t = 100, Cumulus Stage, Snow (purple) forming in updraft. Second Slide: t = 500, Eternal Mature Stage. Episodic overshooting dome and snow or (green) rain-laden downbursts. Distinct convective rainfall maximum. Anvil marked by stable buoyancy oscillations. Third Slide: t = 1500, As in Second Slide, but with distinct stratiform rainfall maximum downwind from convective maximum.
Snow Updraft Air Particles
Accumulated Rainfall Overshooting Dome Anvil with Waves DownburstSnow-Gush Rain
Stratiform Rain Convective Rain
ILLUSTRATING MEASURES OF CHAOS Chaos is marked by large and apparently unpredictable changes in the later state of dynamic systems caused by tiny changes in the initial state, i. e., by non-periodic solutions for systems governed by deterministic laws. Impact on trajectory of particle #200 resulting from changing initial position of particle #300. Top frames, no precipitation weighting. Bottom frames, with precipitation weighting. Trajectories turn red after 500 time steps. Precipitation weighting greatly increases magnitude of chaos.
No ppt No ppt: Change Particle #300 Ppt Ppt: Change particle #300
ILLUSTRATING MEASURES OF CHAOS Chaos is marked by large and apparently unpredictable changes in the later state of dynamic systems caused by tiny changes in the initial state, i. e., by non-periodic solutions for systems governed by deterministic laws. First Slide: Rainfall Rate vs time for two different runs showing irregular and episodic nature of rain gushes. Second Slide: Total Rainfall (red and black lines) and difference of Rainfall Rate (blue dashed line) vs time for two runs which differ by the initial position of only 1 of the 1500 air particles. Solutions diverge after 300 time steps - less than 50 time steps after that particle would have cycled through the updraft and ensuing downburst. Third Slide: Autocorrelation of Rainfall Rate vs time lag showing no hint of periodicity.