Download
1 / 25
250 likes | 392 Views
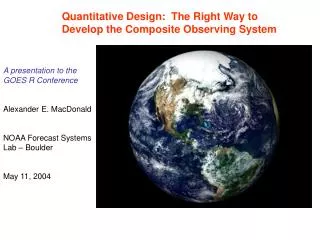
Quantitative Design: The Right Way to Develop the Composite Observing System. A presentation to the GOES R Conference Alexander E. MacDonald NOAA Forecast Systems Lab – Boulder May 11, 2004. Talk Summary. Quantitative Design: The Right Way to Develop the Composite Observing System.

E N D
Quantitative Design: The Right Way to Develop the Composite Observing System A presentation to the GOES R Conference Alexander E. MacDonald NOAA Forecast Systems Lab – Boulder May 11, 2004
Talk Summary Quantitative Design: The Right Way to Develop the Composite Observing System 1. Observing subsystems MUST BE TREATED AS PART OF A COMPOSITE SYSTEM – not as stand alone systems. 2. We are now capable of credible simulations: * Continental Scale * Global Scale 3. Quantitative design is the right way to develop the composite observing system.
Talk Summary Quantitative Design: The Right Way to Develop the Composite Observing System 1. Observing subsystems MUST BE TREATED AS PART OF A COMPOSITE SYSTEM – not as stand alone systems. 2. We are now capable of credible simulations: * Continental Scale * Global Scale 3. Quantitative design is the right way to develop the composite observing system.
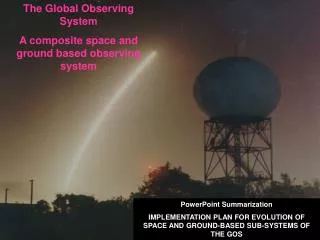
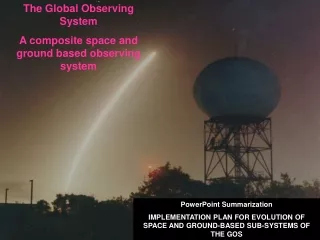
Integrated Global Observing The strategic triad of global observing: Satellites – UAVs – Surface
System Description: Global Hawk could be the Unmanned Aerial Vehicle platform: * Range: 14,000 miles * Speed: 350 knots * Altitude: 60,000 feet * Payload: 1960 lbs * Lease Cost: $ 4 M /plane * Year ops: $ 3 M per plane * ConOP: 2 aircraft, 25% duty cycle * Prime: Northrop AEM in situ
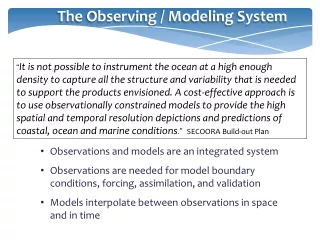
The main idea of the Global Unified Profiling System is to take the most accurate possible profiles from the stratosphere to deep in the ocean over as much of the earth as possible. (Land too!) The profiles should include state (T,p,u,v,q in atmosphere, temperature, current and salinity in the ocean), forcing, and chemistry.
Talk Summary Quantitative Design: The Right Way to Develop the Composite Observing System 1. Observing subsystems MUST BE TREATED AS PART OF A COMPOSITE SYSTEM – not as stand alone systems. 2. We are now capable of credible simulations: * Continental Scale * Global Scale 3. Quantitative design is the right way to develop the composite observing system.
Results From the FSL Regional Lidar OSSE • NOAA/FSL • Steve Weygandt • Stan Benjamin • Steve Koch • Tom Schlatter • Adrian Marroquin • John Smart • Dezso Devenyi • NOAA/NWS/NCEP • Michiko Masutani • NOAA/ETL • - Mike Hardesty • - Barry Rye • Aniceto Belmonte • Graham Feingold • NCAR • - Dale Barker • - Qinghong Zhang
Relationship between Global and Regional OSSEs Nature Run Assimilation Run Global Assimilation Run (GFS) Global Nature Run (ECMWF) Simulated Observations Global Boundary Conditions Boundary Conditions Regional Nature Run (MM5) Regional Assimilation Run (RUC) Simulated Observations Regional
Lidar Data Coverage • Three satellite swaths per 12 h • Profiles of two VLOS components at each point 0430 UTC 0300 UTC 0000 UTC 0130 UTC
OBSERVATION DATA COUNTS Approximate no. of obs data points Ob typeVariables12z15z Raob (Z,T,Q,U,V) 3700 0 Prof/VAD (U,V) 2600 2600 ACARS (T,U,V) 1200 1300 METAR/Buoy(T,Q,U,V) 1600 1600 Lidar (Vr) 1500 1500 • Lidar adds ~8% more wind obs • at raob init times (00z, 12z) • Lidar adds ~14% more wind obs • at non-raob init times (06z, 18z)
15-20 Feb 1993 4-16 Feb 2001 Simulated Data Verify against nature run Real Data Verify against raobs • Does simulated-data impact (OSSE) • match real-data impact (OSE) • for an existing observation type? Regional OSSE Calibration Compare real-data and simulated-data ACARS denial
CNTLerror – EXPerrorCNTLerror Impact of denying ACARS obs on 6-h fcst vector wind RMSE Normalize Errors NEGATIVE VALUE % degradation POSITIVE VALUE % improvement % degradation ACARS denial yields similar % degradation for real-data and OSSE simulated-data
Non-raob init time (06z,18z) Raob init time (00z,12z) 6- hour forecast Assimilation of lidar observations(but no lidar obs in boundary conditions) • Lidar obs improve fcst more at non-raob init times • Lidar obs improvement greatest aloft Impact of adding lidar obs on 6-h fcst vector wind RMSE % degradation % improvement
The relative impact of the profiler data 3-h Model forecast improvement Profiler/ACARS impact calibrated by difference between 13-day experiments with all data and no observations (lateral boundary conditions only) % improvement due to profiler and ACARS data Fact: Profilers are the best data source for the lower part of the atmosphere within the network.
When the profiler data is included, it doubles the “storm energy” that was predicted for the May 3, 1999 Oklahoma tornadoes. Satellite image taken at 0045 UT, during tornado outbreak.
Observing System Simulation must be an important part of our efforts to add new observing capabilities on the geostationary satellites.
The Potential Impact of Space-based Lidar Winds on Weather Prediction: Update on recent experiments atthe NASA DAORobert AtlasData Assimilation OfficeNASA Goddard Space Flight Center
Talk Summary Quantitative Design: The Right Way to Develop the Composite Observing System 1. Observing subsystems MUST BE TREATED AS PART OF A COMPOSITE SYSTEM – not as stand alone systems. 2. We are now capable of credible simulations: * Continental Scale * Global Scale 3. Quantitative design is the right way to develop the composite observing system.
Important Community Efforts Should Embrace Quantitative Design of Observing Systems: • Joint Center for Satellite Data Assimilation • NCEP • OAR Boulder Labs • SSEC • NAVY • University community • International community • etc
Alexander.E.MacDonald@noaa.gov sandymacd@comcast.net