Download
1 / 1
10 likes | 156 Views
BUBA Deployment During SOO Exercise. BUBA Deployment During SOO Exercise. Chris Fuller Jim Bonner Department of Civil Engineering Texas A&M University. In-situ fluorometry for oil-spills. ECO-WETStar Meso-Scale Testing Results. Instrumentation. ABSTRACT

E N D
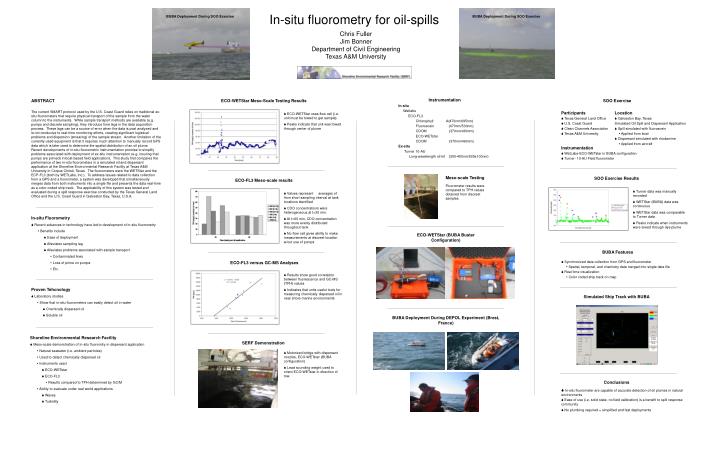
BUBA Deployment During SOO Exercise BUBA Deployment During SOO Exercise Chris Fuller Jim BonnerDepartment of Civil EngineeringTexas A&M University In-situ fluorometry for oil-spills ECO-WETStar Meso-Scale Testing Results Instrumentation ABSTRACT The current SMART protocol used by the U.S. Coast Guard relies on traditional ex-situ fluorometers that require physical transport of the sample from the water column to the instruments. While sample transport methods are available (e.g. pumps and discrete sampling), they introduce time lags in the data acquisition process. These lags can be a source of error when the data is post analyzed and is not conducive to real-time monitoring efforts, creating significant logistical problems and dispersion (smearing) of the sample stream. Another limitation of the currently-used equipment is that it requires much attention to manually record GPS data which is later used to determine the spatial distribution of an oil plume. Recent developments of in-situ fluorometric instrumentation promise to simplify problems associated with deployment of ex-situ instrumentation (e.g. insuring that pumps are primed) in boat-based field applications. This study first compares the performance of two in-situ fluorometers in a simulated oil and dispersant application at the Shoreline Environmental Research Facility at Texas A&M University in Corpus Christi, Texas. The fluorometers were the WETStar and the ECP-FL3 (both by WETLabs, Inc.). To address issues related to data collection from a GPS and a fluorometer, a system was developed that simultaneously merges data from both instruments into a single file and presents the data real-time as a color-coded ship track. The applicability of this system was tested and evaluated during a spill response exercise conducted by the Texas General Land Office and the U.S. Coast Guard in Galveston Bay, Texas, U.S.A. SOO Exercise In-situ Wetlabs ECO-FL3 Chlorophyll A(470nm/695nm) Fluoroscein (470nm/530nm) CDOM (370nm/460nm) ECO-WETstar CDOM (370nm/460nm) Ex-situ Turner 10-AU Long-wavelength oil kit (300-400nm/500±100nm) Participants Texas General Land Office U.S. Coast Guard Clean Channels Association Texas A&M University Location Galveston Bay, Texas Simulated Oil Spill and Dispersant Application Spill simulated with fluoroscein Applied from boat Dispersant simulated with rhodamine Applied from aircraft ECO-WETStar uses flow cell (i.e. unit must be towed to get sample) Peaks indicate that unit was towed through center of plume • Instrumentation • WetLabs-ECO-WETstar in BUBA configuration • Turner- 10-AU Field fluorometer Meso-scale Testing SOO Exercise Results ECO-FL3 Meso-scale results Fluorometer results were compared to TPH values obtained from discreet samples Turner data was manually recorded WETStar (BUBA) data was continuous WETStar data was comparable to Turner data Peaks indicate when instruments were towed through dye plume Values represent averages of from short sampling interval at tank locations identified CDO concentrations were heterogeneous at t=30 min. At t=60 min, CDO concentration was more evenly distributed throughout tank No flow cell gives ability to make measurements at discreet location w/out use of pumps • In-situ Fluorometry • Recent advances in technology have led to development of in-situ fluorometry Benefits include • Ease of deployment • Alleviates sampling lag • Alleviates problems associated with sample transport Contaminated lines Loss of prime on pumps Etc. ECO-WETStar (BUBA Buster Configuration) BUBA Features ECO-FL3 versus GC-MS Analyses • Synchronized data collection from GPS and fluorometer • Spatial, temporal, and chemistry data merged into single data file • Real time visualization • Color coded ship track on map Results show good correlation between fluorescence and GC-MS (TPH) values Indicates that units useful tools for measuring chemically dispersed oil in near shore marine environments Proven Tehcnology Laboratory studies Show that in-situ fluorometers can easily detect oil in water Chemically dispersed oil Soluble oil Simulated Ship Track with BUBA BUBA Deployment During DEPOL Experiment (Brest, France) • Shoreline Environmental Research Facility • Meso-scale demonstration of in-situ fluoromtry in dispersant application Natural seawater (i.e. ambient particles) Used to detect chemically dispersed oil Instruments used ECO-WETstar ECO-FL3 Results compared to TPH determined by GC/M Ability to evaluate under real world applications Waves Turbidity SERF Demonstration Motorized bridge with dispersant nozzles, ECO-WETstar (BUBA configuration) Lead sounding weight used to orient ECO-WETstar in direction of tow. Conclusions In-situ fluorometer are capable of accurate detection of oil plumes in natural environments Ease of use (i.e. solid state, no field calibration) is a benefit to spill response community No plumbing required = simplified and fast deployments