Download

1 / 13
130 likes | 270 Views
The Annual Behavior of Backscattering And Coherence of PALSAR Data. Wenjian Ni 1,2 , Zhifeng Guo 1 , Zhiyu Zhang 3 , Guoqing Sun 2 1 Institute of Remote Sensing Applications of Chinese Academy of Sciences 2 Department of Geography, University of Maryland, College Park

E N D
The Annual Behavior of Backscattering And Coherence of PALSAR Data Wenjian Ni1,2, Zhifeng Guo1, Zhiyu Zhang3 , Guoqing Sun2 1Institute of Remote Sensing Applications of Chinese Academy of Sciences 2Department of Geography, University of Maryland, College Park 3Beijing Normal University niwenjian@irsa.ac.cn / wenjian@umd.edu
OutLine • 1. Introduction • 2.Test site and data • 3. The annual behavior of Backscattering • 4. The annual behavior of Coherence • 5.Conclusion
Introduction • PALSAR Mosaic data provide a great chance to map biomass at regional scale; • The data covered a year and several seasons. • The seasonal effects on coherence have been investigated using ERS1/2 tandem (Koskinen, J.T. et. al., 2001), and JERS data (Eriksson, L.E. et al., 2003) ; • How PALSAR data were affected by precipitation and temperature?
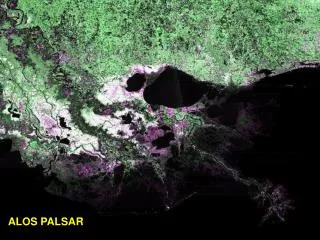
The true color IKNOS image of study site (06/24/2002 ) The multi-temporal backscattering data (HV). Red: cycle 14, Green: Cycle 19, Blue Cycle 20; Test site and data missed
2007/10/10 2008/01/10 2007/07/10 2007/08/25 2008/02/25 2008/04/11 2008/05/27 2008/07/12 Backscattering over a year (HH) There was no obvious change on spatial pattern
Backscattering over a year Rain (HH) Leaves fall Frozen and snow sprout of vegetation thawing and snow melting Frozen Precipitation: 2007/07/09: No record 2007/07/10: No record 2007/08/25: 4:00 (0.25 mm) 21:00 (1.52 mm) 23:00 (0.25 mm) No Precipitation on other dates of data acquisition.
Coherence over a year Rows:horizontal baseline, Columns: vertical baseline Baseline length IKNOS 2007/10/10 2008/01/10 2007/08/25 2008/04/11 2008/05/27 2008/07/12 2008/02/25 There were totally 28 interferometric pairs formed by the 8 scenes of PALSAR data. 2007/07/10 vs. others
2007/07/10 vs. others Snow and frozen
IKNOS 2007/07/10-2007/08/25 2007/08/25-2007/10/10 2007/10/10-2008/01/10 2008/01/10-2008/02/25 2008/02/25-2008/04/11 2008/04/11-2008/05/27 2008/05/27-2008/07/12 Successive interferometric pairs
Nearly noise Baseline 3992.907 m • The interferometric pairs from summer was the best; • that composed by summer and autumn or by spring and summer was the middle; • that composed by winter data was the worst;
(d) (c) (a) (b) Spatial pattern of coherence and SRTM minus PALSAR-DEM. (a) H75 from LVIS Ground Elevation (lge) acquired on 2009; (b) SRTM minus DEM (2007/07/10~ 2007/08/25) (HV); (c) Coherence of 2007/07/10~2007/08/25 (HH); (d) Coherence of 2008/04/11~2008/05/27(HH); • The spatial pattern of Figure a and b was consistent. • Figure d was obviously opposite to that of Figure 8-c. This may be attributed to the melt of snow which leads to the high soil moisture. The double bounce between canopy and ground at high biomass area was the dominant and stable scattering component.
Conclusion • In terms ofbackscattering, Summer data was stable. Leaves falling, frozen and Snow accumulation decrease the autumn and winter data. Thawing, melting of snow and vegetation sprout increase the spring data. • Interferometric pair from summer data has the best coherence; Snow and frozen hinder the interferometric process of winter data. Summer data is the best to be used to map biomass • The difference of SRTM and DEM from PALSAR InSAR data can provide forest height information. • Coherence from spring data was positively correlated with forest coverage. Why and How ? Information lies in variations! How to use the data in other seasons?
Thank you for your attention And Have a nice time in Vancouver!