Download
1 / 11
110 likes | 306 Views
8-3 Estimation Estimating p in a binomial distribution. Just suppose.

E N D
Just suppose You have a sample proportion and want to extend this to the population. For instance, perhaps you are now investigating a lake fed by a stream that comes off of the river near the Springfield Nuclear Power Plant. In a sample of 104 fish you find 54 three eyed fish. The sample proportion is 51.9%. How close to reality is that? What if you took a different sample? Would it be the same?
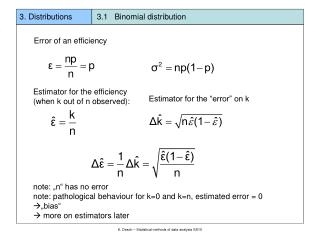
Estimating p The concept behind the application is the same as estimating μ. P(ê – E < p < ê + E)= c And the error is based again on the estimated z score. BUT what is E usually a measure of?
Error Error is again zcσ. What is σ?
Error Error is again zcσ. What is σ? For the normal approximation,
Error Error is again zcσ. What is σ? For the normal approximation, And we don’t know p or q. So instead use the point estimate that Therefore, Also seen as SE(ê), Standard Error…
Practice In a random sample of 519 judges, it was found that 285 were introverts. A) Find a point estimate for p B) Find a 99% confidence interval for p. C) Give a brief interpretation of the meaning of the confidence interval. D). Are np>5 and nq>5 satisfied in this problem?
Practice 2 In May 2002, the Gallup Poll asked 537 randomly sampled adults the question “Generally speaking, do you believe the death penalty is applied fairly or unfairly in this country today?” Of these, 53% answered “Fairly” and 7% said they didn’t know. What can we conclude from this survey? Aim for 95% confidence.. .487 to .573
Practice 2 Follow-up questions 1. If we want to be 98% confident, would the confidence interval need to be wider or narrower? 2. The margin of error is about 4%. To reduce it to 3%, would the level of confidence be higher or lower? 3. If more people were polled, would the margin of error be larger or smaller? wider lower smaller
Phrasing 1. 51.9% of all fish in the lake have 3 eyes. 2. It is probably true that 51.9% of all fish in the lake have 3 eyes. 3. We don’t know exactly what proportion of fish in the lake have 3 eyes, but we know that it is within the interval 51.9% ± 2(4.9%). That is, it is between 42.1% and 61.7%. 4. We don’t know exactly what proportion of fish in the lake are infected, but the interval from 42.1% and 61.7% probably contains the true proportion. 5. It can be stated with 95% confidence that between 42.1% and 61.7% of lake fish have 3 eyes.
Phrasing (cont) Don’t generalize past the situation you have. Statement is about p, not ê. Confidence interval implies that you know generally where p is but not exactly.