Download
1 / 3
30 likes | 190 Views
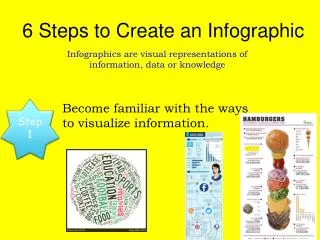
Infographics are visual representations of information, data or knowledge. 6 Steps to Create an Infographic. Step 1. Become familiar with the ways to visualize information. . Step 2. Research and collect data. Step 3. Hand sketch a draft. Step 4. Gather images and cite the sources.

E N D
Infographics are visual representations of information, data or knowledge 6 Steps to Create an Infographic Step 1 Become familiar with the ways to visualize information.
Step 2 Research and collect data. Step 3 Hand sketch a draft. Step 4 Gather images and cite the sources. 123RF PicFindr Edupics Pics4Learning Photl Clip Art ETC
Step 5 Pick colors and fonts. Step 6 Create infographic and cite sources. Sources: Schrock, Kathy. “Power Point Etiquette” Slideshare Presentation, http://www.slideshare.net/kathyschrock/powerpoint-for-administrators How to Use Social Media in the Classroom: http://dhoozy.com/?p=1504 Hamburger: http://www.markedlines.com/a-roundup-of-25-jaw-dropping-infographics/ Images from http://www.123rf.com Created by Tamara Cox, Palmetto Middle School


![Steps to Create A Stamped Concrete Patio [Infographic]](https://cdn5.slideserve.com/9942095/slide1-dt.jpg)