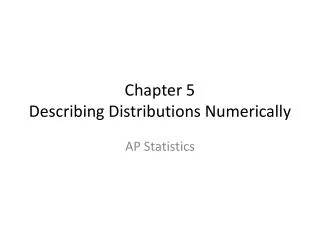
Chapter 5 Describing Distributions Numerically
80 likes | 310 Views
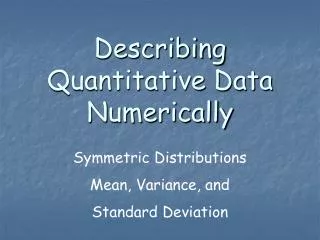
Chapter 5 Describing Distributions Numerically . *Mean, Median *Range, Standard Deviation, IQR *Box-and-Whisker Plots (Box Plots) *5 number summary . Remember!?!. Mean : add up all the data values then divide by the number of values

Chapter 5 Describing Distributions Numerically
E N D
Presentation Transcript
Chapter 5Describing Distributions Numerically *Mean, Median *Range, Standard Deviation, IQR *Box-and-Whisker Plots (Box Plots) *5 number summary
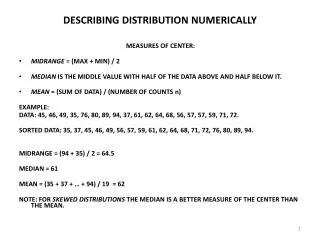
Remember!?! • Mean: add up all the data values then divide by the number of values • Median: the middle number in an arranged set of data (if there is no middle number find the mean between the two middle numbers) • Range: max value – min value
Patriots Salaries 13 - 14 • Find the mean, median, and range for the data
When to use what? • When your data is skewed • center: median • range: Interquartile Range (IQR) • When your data is symmetric • center: mean • range: standard deviation (SD) **Always check the distribution of the data before deciding which measure of center and spread to use**
5 Number Summary • Minimum • Lower Quartile (Q1) [median of lower 50% of the data] • Median • Upper Quartile (Q3) [median of the upper 50% of the data] • Maximum • Calc: • enter data into the list • STAT ; CALC ; 1: 1 – VAR Stats
How to Determine an Outlier • If a data value is more than 1.5 times the IQR away from the upper or lower quartile it is an outlier • Q1 – 1.5IQR • Q3 + 1.3IQR
Box-and-Whisker Plots(Box Plots) • A way to display the 5 number summary