Download
1 / 10
100 likes | 352 Views
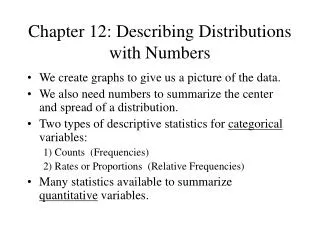
Chapter 12: Describing Distributions with Numbers. We create graphs to give us a picture of the data. We also need numbers to summarize the center and spread of a distribution. Two types of descriptive statistics for categorical variables: 1) Counts (Frequencies)

E N D
Chapter 12: Describing Distributions with Numbers • We create graphs to give us a picture of the data. • We also need numbers to summarize the center and spread of a distribution. • Two types of descriptive statistics for categorical variables: 1) Counts (Frequencies) 2) Rates or Proportions (Relative Frequencies) • Many statistics available to summarize quantitative variables.
Homeruns in Baseball Question: Who is the best home run hitter ever in major league baseball? Players with high numbers of homeruns in seasons: • Babe Ruth • Roger Maris • Mark McGwire • Sammy Sosa • Barry Bonds
Median and Quartiles The median (M) is the midpoint of a distribution when the observations are arranged in increasing order. Number such that half the observations are smaller and the other half are larger. (p. 219) • List the data in order from smallest to largest • If n is odd, the median is the middle value. • If n is even, the median is the mean of the middle two values.
M for Sosa and Maris Calculate M for Sosa’s homeruns in a season (8 seasons, to 1999). • Data: 15, 10, 33, 25, 36, 40, 36, 66 Calculate M for Maris’s homeruns in a season (11 seasons). • Data: 14, 28, 16, 39, 61, 33, 23, 26, 13, 9, 5
Percentiles • p×100% percentile – the value of a variable such that p×100% of the values are below it and (1-p)×100%of the values are above it where 0 < p < 1. • For the 35th percentile, p=0.35. • Where have you seen percentiles before?
Quartiles • First Quartile (Q1): The value such that 25% of the data values lie below Q1 and 75% of the data values lie above Q1. (25th percentile) • Third Quartile (Q3): The value such that 75% of the data values lie below Q3 and 25% of the data values lie above Q3. (75th percentile) • The median is the second quartile (Q2) . (50th percentile)
Calculating percentiles: • Let n be the number of data values. • Order the n values from largest to smallest. • Calculate the product, n×p. • If the product is not an integer (0,1,2,3,…), then round it up to the next integer and take the corresponding ordered value. • If the product is an integer, say k, then average the kth and (k+1)-st ordered values.
5-Number Summary The 5-number summary of a data set consists of the following descriptive statistics (p. 221): Minimum, First Quartile (Q1), Median, Third Quartile (Q3), Maximum Give the 5-number summaries for Sosa and Maris’s homeruns.
Boxplot A boxplot is a graphical representation of the 5-number summary. (p. 221) • A central box spans the quartiles (Q1 to Q3) Inter-quartile Range = IQR = Q3 - Q1 • A line in the box marks the median • Lines (whiskers) extend from box to the minimum and maximum observations.
Constructing Boxplots 1) Compute the 5-number summary. 2) Draw a vertical line at the Q1 and Q3. 3) Draw two horizontal lines to complete the box. 4) Draw a vertical line at the median. 5) Draw “whiskers” to the extremes (Min and Max). Draw boxplots for Sosa and Maris’s homeruns.