Download
1 / 36
360 likes | 381 Views
Explore findings from three comprehensive studies on port capacity, productivity, and truck drayage practices. Learn about key metrics, terminal dimensions, and solutions for enhancing efficiency.

E N D
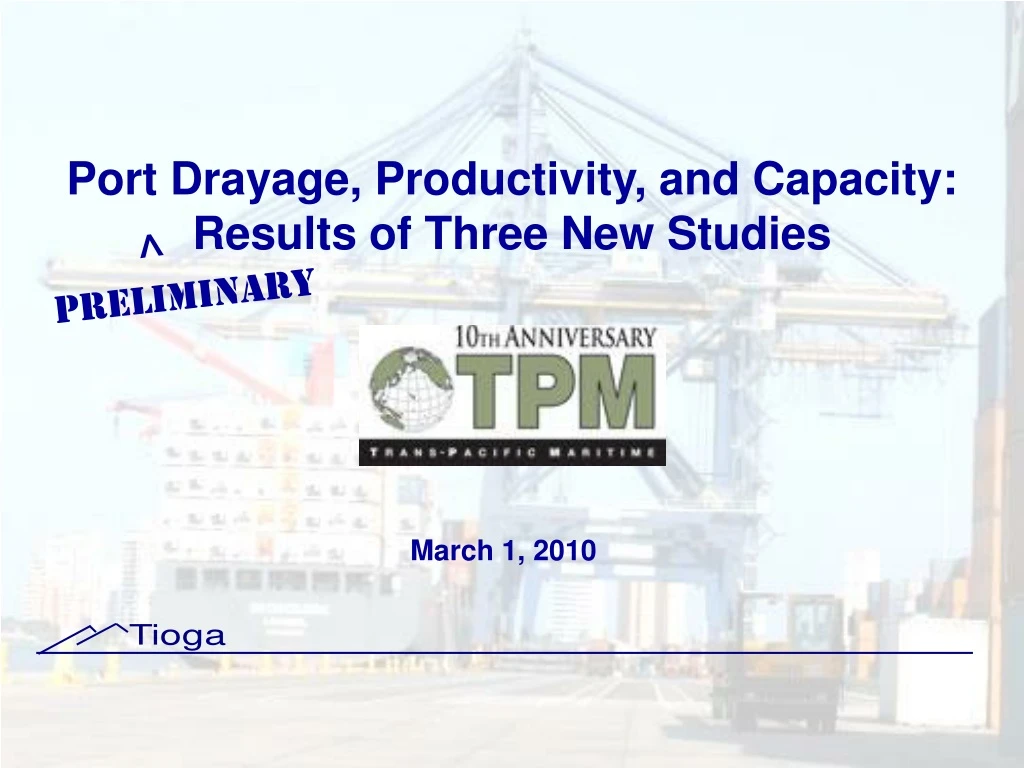
Port Drayage, Productivity, and Capacity: Results of Three New Studies ^ PRELIMINARY March 1, 2010
Three New Studies • Port Capacity Study, sponsored by the USACE Institute of Water Resources (IWR) CDM as prime contractor • Port Productivity Study, sponsored by the Container Handling Cooperative Program (CHCP) • Truck Drayage Practices, sponsored by the National Cooperative Freight Research Program, Transportation Research Board, National Academy of Sciences, Project 14 • All three studies nearing completion
Port Capacity and Productivity IWR Port Capacity Study - Key Questions • What is East and Gulf Coast port capacity? • What constrains capacity? • Can they handle new Panama Canal vessels and business? CHCP Port Productivity Study - Key questions • Are we using the right productivity measures? • Where do we get the data? • How do we approach benchmarking? • How do we encourage productivity improvements?
TEU per Acre? Are we losers? BUSTED
Five Dimensions of Terminal Capacity STACKING HEIGHT CY DEPTH (AREA) OPERATING HOURS DRAFT BERTH LENGTH
CY Metrics Cheap land at U.S. ports leads to: • Lower TEU/acre • Dedicated carrier terminals • On-terminal chassis pools • On-dock rail transfer • Wheeled operations • Fewer moves per box • Lower terminal operating costs Key Metrics • TEU per CY acre • Slots per acre (density) and TEU/slot (turns) • Utilization – annual TEU vs. CY capacity
CY vs. Gross Acres • US terminals include more functions • On average, only half the gross acres are used as CY TRANSLOAD STAFF PARKING RAIL CHASSIS LOT CY
Gross vs. CY TEU per Acre On TEU per CY acre, US terminals suddenly look “world class” Many, but not all, ports and terminals publish CY acreage
Estimated TEU Slots per CY Acre (Density) AVERAGE = 190 Many, but not all, ports and terminals publish TEU slot data
CY Utilization: 2008 TEU per Slot (Turns) AVERAGE = 34 MAXIMUM = 70?
Crane Metrics The primary task is turning the vessel • Crane utilization and productivity can be measured in TEU and vessels worked • Crane efficiency would be measured in moves/hour, but data are seldom available There is a critical tradeoff • Annual crane output is higher if fewer cranes work the vessels BUT • Vessel turns are faster and more reliable with more cranes
How many cranes per berth? Maximum of 5? 8 cranes for 3 berths 24 cranes for 8 berths Average is 2.2 32 cranes for 22 berths 7 cranes for 6 berths
How hard do we work those cranes? Some, but not all, ports and terminals publish crane moves per hour
Estimated 2008 Crane Utilization TEU vs. Max Sustainable TEU AVERAGE = 35%
Berth & Vessel Metrics Berth utilization can be measured in multiple ways • Vessel calls and TEU per berth • TEU as percentage of maximum vessel capacity • TEU as percentage of current vessel capacity Vessel utilization is also a factor • Average vessel size compared to maximum possible for berth and channel depth • Average TEU per vessel as % of vessel capacity
Estimated 2008 Berth Utilization CURRENT TEU VS. CAPACITY NEAR TERM WITHCURRENT VESSELS LONG TERM WITHMAXIMUM VESSELS
East & Gulf Coast Capacity Most East and Gulf ports have CY, crane, and berth capacity to handle additional near-term Panama Canal business • As larger vessels are phased in over time, most East and Gulf Coast ports will have to add cranes • NYNJ and Norfolk can handle large vessel drafts today, although NYNJ has a long-term air draft problem • Baltimore, Philadelphia, Charleston, and Savannah have dredging programs in progress or proposed • Rising volumes will eventually require additions to road and rail infrastructure
US Port Productivity Terminals attempt to balance the five dimensions of capacity • Berths long and deep enough for the biggest expected vessel • Enough berths and cranes to avoid vessel delay • Enough CY acreage and density to avoid congestion • Enough hours to turn the vessel US Ports are underutilized, not inefficient • Cheap land has led to large, individual terminals instead of small multi-user terminals • Most ports have substantial excess capacity • Lower density holds down costs Better productivity metrics are possible • “Sometimes” data such as CY acres, TEU slots, and crane hours can yield better measures
NCFRP-14 Port Drayage Project Key questions • Where are the bottlenecks and delays? • What are the causes? • What are the solutions? Answers • The terminal drayage bottlenecks are the gate, CY, and chassis pool • The causes are congestion and exceptions • The solutions include terminal improvements, operating practices, and exception reductions
Terminal Congestion Terminal data (which exclude gate queues) show the expected correlation between volume and turn times 2008 DATA FROM MARINE TERMINAL SYSTEM
Chassis Transactions and Pools Chassis transactions add drayage time and delays at stacked terminals • Two sources of delay – finding the chassis, and waiting for the box • Two source of exceptions – chassis problems and transfer problems • Moving pools off-site to save space adds drayage trips and time • Chassis interchange adds time to gate transactions In the near term, neutral pools expedite chassis searches and reduce equipment problems In the long run, trucker or third-party chassis supply should reduce terminal time and exceptions
Gate Queuing – Webcam Study Example LONG QUEUES IN THE MORNING AND FOR EXPORT CUT-OFFS
Lunch Break Closures - Ouch! DATA COLLECTION VIA TERMINAL WEBCAMS TERMINAL GATE CLOSED FOR LUNCH- FRONT ROW SPENDS 72-83 MINUTES WAITING
Gates – 3 to 4 Minutes, but Too Many Exceptions 5% of the moves use 14-18% of the total time and back up the queue
Turn Times – Again, Too Many Exceptions 5% of the moves use 14% of the total time QUALCOMM data show added queue time
Process Issues Cause Exceptions • 5% of transactions get trouble tickets • 80% due to booking, dispatch, or system errors • Each one adds an hour
Experience Matters The average is 5%
The Trucking Company and Ocean Carrier Matter The average is 5%
Drayage Solutions Reducing Bottlenecks • Keep gates open during lunch • Chassis pool – Saves time in stacked terminals • “Automated” gates – OCR, RFID, saves gate time • Two-stage gates – Gets exceptions out of line • Appointment system – May save time, depends on implementation Reducing Exceptions – The 5% “tail” • Talk – regular trucker/terminal/port/customer meetings • Manage booking, dispatch, and system communications • Choose experienced trucker and efficient ocean carrier
Transition from Lower to Higher Density Volume growth will drive denser, more capital-intensive operations
Terminal & Drayage Tradeoffs Higher terminal density has costs… • More cranes to handle larger ships • More berth and CY congestion on vessel days • Higher terminal operating costs due to more moves per box, more labor, and more capital • Higher drayage costs due to more time and moves in terminals • Greater impacts on roads and rails The transition has to be managed carefully… • A long-term solution to on-terminal chassis supply • Terminal operations that move both vessels and trucks • Gates that expedite clean transactions and separate problems • Systems to cope with rising complexity of terminals and transactions
Bottom Line: What does the customer want? Better, faster, cheaper
Are customers willing to switch? Yes! It depends on….? Costs being equal.
Thank you! Questions? Contacts and Follow-ups Container Handling Cooperative Program: wgorfink@earthlink.net, Robert.Bouchard@dot.net National Cooperative Freight Research Program Project 14: http://144.171.11.40/cmsfeed/TRBNetProjectDisplay.asp?ProjectID=2412 On-line survey: http://www.surveymonkey.com/s.aspx?sm=gKU1ZDY25GgNzNAI1WK9mw_3d_3d Tioga website: www.tiogagroup.com Project manager: dsmith@tiogagroup.com, 925-631-0742