Download
1 / 46
460 likes | 566 Views
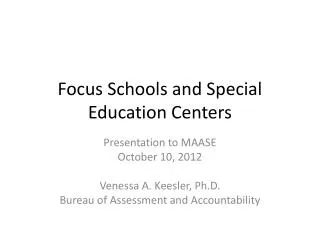
Focus Schools. Presented by: Michigan Department of Education Webinar Presentation by: Joann Neuroth, Office of Education Improvement and Innovation (OEII) Venessa Keesler, Bureau of Assessment and Accountability (BAA). Overview of the Session. What is a Focus School?

E N D
Focus Schools Presented by: Michigan Department of Education Webinar Presentation by: Joann Neuroth, Office of Education Improvement and Innovation (OEII) Venessa Keesler, Bureau of Assessment and Accountability (BAA)
Overview of the Session • What is a Focus School? • How was our school identified as a Focus School? How can I review the data regarding this designation? • What does this mean for our school? • What supports will be provided to assist with this effort? • What are the next steps?
What is a Focus School? • Schools with the largest achievement gaps in scale score between the top 30% of students and bottom 30% of students within a school • Focus schools may have high average performance overall, but have a significantly large gap, suggesting struggles addressing low achieving students
What is the purpose of Focus School designation? • Identifying Focus Schools is a critical component to closing achievement gaps within schools and statewide • Focus schools highlight where changes in teaching and learning practices need to be undertaken to respond to the learning needs of low-achieving students. • These changes are difficult, and both accountability and support need to be differentiated.
How was our school identified as a Focus School? • Top-to-Bottom list includes a component that examines the gap in achievement scores between top 30% and bottom 30% of students within a school • Gaps are standardized between all students using a common assessment within a school, and then averaged for the school • Gaps are calculated for all subject areas and combined
How were Focus schools identified (continued)? • Average gap is then standardized and ranked among all schools • 10% with largest gaps are identified as Focus Schools
What data supports the designation? Z-scores compare schools
Common concerns about this metric • Are Focus schools only high-achieving schools? • Are Focus schools only high socioeconomic status schools? • Is the bottom 30% subgroup in Focus schools actually high performing? • Are schools more likely to be Focus schools if they have [fill in the blank group] kids? Z-scores compare schools
Bottom 30% are not high achieving ... Across all subject areas and grade levels, the bottom 30% subgroup consistently had average achievement z-score below zero, and most of them are between -0.5 and -1.5. (This example: E/MS Reading) Top 30% Bottom 30%
Not dominated by any one subgroup ... • Focus schools have higher concentrations of subgroups in bottom 30% than other schools
Pause to frame METRICS questions • We invite you to e-mail questions to : Mde-accountability@michigan.gov • We will answer as many as time permits at the end of this webinar • We will post answers to all questions on a “Focus FAQ” blog so that you can browse other districts’ answers as well
What does this mean for our school(s)? • Target efforts toward supporting needs of lowest achievers in the school (likely through strengthening or recalibrating the multi-tiered system of support) • Set-asides for district Title I funding • No SES required • Choice and Transportation still required • District Support for Focus schools required • Schools cannot receive “green” status on School Report Card or AYP until gaps are minimized
Requirements and Supports for Focus Schools • Focus schools engage in professional dialogue with district administrators • Deep diagnostic data analysis • Differentiated district support for Focus schools • Revised School and District Improvement Plans • Title I Statewide System of Support (SSoS) • District Toolkit • School-specific Data Wall • District Resource Survey • District Improvement Facilitators trained to coach district administrators
Title I Funding for these Supports • State-funded District Improvement Facilitator* and uniform “data wall” • Set aside 10% of district Title I allocation: • Choice and Transportation (required) plus • Enhanced multi-tiered system of support, or • Professional learning aligned with building data • Set aside 10% of building Title I allocation: • Professional learning on multi-tiered system of support or scaffolded instruction for lowest performers or essential elements for MI-ACCESS • Weekly, daily teacher collaboration time • Surveys of enacted curriculum, or • Culture/climate interventions *in Year 2 or after, DIF is funded through district set-aside
How does a school EXIT Focus School status? • Focus schools are designated based on year-to-year status of achievement gap relative to other schools in the state • Following the end of four years as a Focus school, a school must make AYP, including the safe harbor target for the bottom 30% subgroup • Submit documentation to MDE regarding efforts taken to reduce gaps and sustain the reduction of gaps over time
Good Getting Great (GGG) Schools • GGG designates schools with “permanent” gaps that are being well-addressed • GGG schools are designated upon submission of documentation from facilitated dialogue: • Overall achievement is 75% or above • Bottom 30% is making rapid progress toward Safe Harbor status • GGG schools are removed from Year 2 and 3 Focus lists, even though achievement gap merits inclusion
What are the next steps? • Develop a plan to address internal and community communications regarding the Focus school designation • Ask clarification questions through the FAQ blog ... and browse others’ answers • Ensure 10% district set-aside and 10% building set-aside in consolidated application • Send Choice/Transportation letters to parents by August 21.
Next steps? (continued) • Discontinue agreements with SES providers • Consider ways to check implementation of, and strengthen/retarget the school’s multi-tiered system of support. • Identify the district administrator who will partner with the District Improvement Facilitator (DIF) to support the school. • Meet the DIF in mid-September to plan how to engage in deep, data-rich dialogue with schools regarding achievement gaps.
Next steps? (concluded) • Utilize the District Toolkit strategies to examine systemic considerations and possible remedies for student achievement gaps. • Revise both school and district improvement plans to reflect new strategies. • Conduct stakeholder meetings with populations represented in the bottom 30% • Participate in the Superintendent’s “Dropout Challenge” with 10-15 students in bottom 30%
For More Information • www.mi.gov/focusschools • Resources Include: • Focus school lookup tool • FAQ for Focus Schools • “At-a-Glance” Overview • Business Rules for metric calculations • This Overview Powerpoint • Summary statistics
Questions • Ask now by emailing Mde-accountability@michigan.gov • Supports for Focus Schools: Fran Lake, Office of Educational Improvement and Innovation • lakef@michigan.gov, • 517-335-2957 • Accountability Designations: Bureau of Assessment and Accountability, Evaluation Research and Accountability Unit • Mde-accountability@michigan.gov, • 877-560-8378, option 6
Analyses of the Focus Metric Other common Concerns
Understanding the “Bottom 30%” • The bottom 30% subgroup is comprised of the traditional ESEA subgroups. • All “traditional” subgroups are represented. • Most commonly occurring subgroups in the Bottom 30%: • students with disabilities • limited English proficient students • black/African American students • economically disadvantaged students
Focus Schools Overall • Focus schools have even higher concentrations of the subgroups (mentioned previously) in their bottom 30% subgroup than non-Focus schools. • This indicates that the Focus methodology is • still detecting differences in achievement in traditional subgroups • identifying schools where there are not only large achievement gaps in general, but where there are also large gaps between demographic subgroups • identifies schools that otherwise may not be identified using traditional subgroup methodology
More about the bottom 30% subgroup • Analyses conducted to determine if the bottom 30% subgroup consisted solely of any demographic subgroup • To address the question: • Does the bottom 30% “solely” consist of any one subgroup?
Bottom 30% in Focus Schools: More Black Students than non-Focus schools
But: Focus Schools overall—black students not overly represented
Focus Schools Overall • Focus schools have even higher concentrations of the subgroups (mentioned previously) in their bottom 30% subgroup than non-Focus schools. • This indicates that the Focus methodology is • - still detecting differences in achievement in traditional subgroups • - identifying schools where there are not only large achievement gaps in general, but where there are also large gaps between demographic subgroups • -identifies schools that otherwise may not be identified using traditional subgroup methodology
Bottom 30% High Performing? • Is the bottom 30% subgroup in Focus schools actually high-performing? • Is the bottom 30% subgroup in Focus schools higher than the top 30% subgroup in non-Focus schools? • Is the top 30% subgroup in focus schools higher-performing than non-focus schools?
Answer: No • Across all subject areas and E/MS and high school, the bottom 30% subgroup consistently had average achievement z-score below zero, and most of them are between -0.5 and -1.5.
Example: E/MS Reading Top 30% Bottom 30%
Are certain types of schools more likely to be Focus schools? • Have not detected any significant patterns yet • Continuing to analyze the data • Because metric compares top 30 percent of kids to bottom 30 percent of kids in the school, it’s unlikely the gap is being driven exclusively by one group or type of kids.
Is there a relationship between the economic disadvantage gap and the achievement gap? • Hypothesis: Schools with a range of student economic disadvantage are more likely to be Focus schools, because the higher income kids are all in the top 30% and the low income kids are all in the bottom 30% • This would make the metric a proxy for socioeconomic gap, not achievement gap
How does the Focus metric differ from AYP subgroups? • Top-to-Bottom list includes the achievement gap between top 30% and bottom 30% of students within a school. • Unlike subgroup designations, which are limited by size of groups and demographic status only, this approach targets ACHIEVEMENT gaps and THEN asks the demographic question. • Methodology detects differences in achievement within subgroups; between subgroups; or with small populations.