Download
1 / 1
10 likes | 134 Views
A Comparison of INLA and MCMC for the Estimation of Smoothed Risk Maps in Epidemiology. Rebeca Ramis 13 , Virgilio Gómez-Rubio 2 , Peter J. Diggle 1 & Gonzalo López-Abente 3 1 Division of Medicine , Lancaster University, UK. {r.ramis,p.diggle}@lancaster.ac.uk

E N D
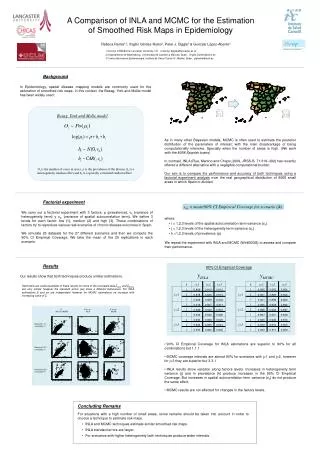
A Comparison of INLA and MCMC for the Estimation of Smoothed Risk Maps in Epidemiology • Rebeca Ramis13, Virgilio Gómez-Rubio2, Peter J. Diggle1 & Gonzalo López-Abente3 • 1 Division of Medicine, Lancaster University, UK. {r.ramis,p.diggle}@lancaster.ac.uk • 2 Departamento de Matemáticas, Universidad de Castilla-La Mancha, Spain. Virgilio.Gomez@uclm.es • 3 Centro Nacional de Epidemiología, Instituto de Salud ’Carlos III’, Madrid, Spain. glabente@isciii.es Background In Epidemiology, spatial disease mapping models are commonly used for the estimation of smoothed risk maps. In this context, the Besag, York and Mollie model has been widely used: Besag, York and Molie model As in many other Bayesian models, MCMC is often used to estimate the posterior distribution of the parameters of interest; with the main disadvantage of being computationally intensive. Specially when the number of areas is high. (We work with the 8068 Spanish towns) In contrast, INLA (Rue, Martino and Chopin,2009, JRSS-B, 71:319–392) has recently offered a different alternative with a negligible computational burden. Our aim is to compare the performance and accuracy of both techniques using a factorial experiment analysis over the real geographical distribution of 8068 small areas in which Spain in divided. Oi is the number of cases in area i, ρ is the prevalence of the disease, hi is a heterogeneity random effect and bi is a spatially correlated random effect. Factorial experiment yijk = mean(90% CI Empirical Coverage for scenario ijk) We carry out a factorial experiment with 3 factors: ρ (prevalence), vh (variance of heterogeneity term) y vb, (variance of spatial autocorrelation term). We define 3 levels for each factor: low (1), medium (2) and high (3). These combinations of factors try to reproduce various real scenarios of chronic disease outcomes in Spain. We simulate 25 datasets for the 27 different scenarios and then we compute the 90% CI Empirical Coverage. We take the mean of the 25 replications in each scenario. • where: • i = 1,2,3 levels of the spatial autocorrelation term variance (vb) • j = 1,2,3 levels of the heterogeneity term variance (vh) • k =1,2,3 levels of prevalence (ρ) • We repeat the experiment with INLA and MCMC (WinBUGS) to assess and compare their performance. Results 90% CI Empirical Coverage Our results show that both techniques produce similar estimations. ^ ^ Here there are some examples of these results for some of the simulated data μINLA and μMCMC are very similar however the standard errors (se) show a different behaviours. For INLA estimations μ and se are independent however for MCMC estimations se increase with increasing value of μ. ^ ^ vs se INLA vs se MCMC INLA vs MCMC Scenario.1.1.1 (simulation 1) • 90% CI Empirical Coverage for INLA estimations are superior to 90% for all combinations but 1.1.1 • MCMC coverage intervals are almost 90% for scenarios with j=1 and j=2, however for j=3 they are superior but 3.3.1 • INLA results show variation along factors levels. Increases in heterogeneity term variance (j) and in prevalence (k) produce increases in the 90% CI Empirical Coverage. But increases in spatial autocorrelation term variance (vh) do not produce the same effect. • MCMC results are not affected for changes in the factors levels. Scenario.2.2.2 (simulation 1) Scenario.3.3.3 (simulation 1) • Concluding Remarks • For situations with a high number of small areas, some remarks should be taken into account in order to choose a technique to estimate risk maps. • INLA and MCMC techniques estimate similar smoothed risk maps. • INLA standard errors are larger. • For scenarios with higher heterogeneity both techniques produce wider intervals.