Download
1 / 57
570 likes | 712 Views
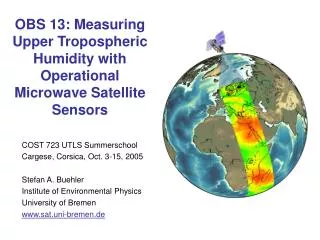
OBS 13: Measuring Upper Tropospheric Humidity with Operational Microwave Satellite Sensors. COST 723 UTLS Summerschool Cargese, Corsica, Oct. 3-15, 2005 Stefan A. Buehler Institute of Environmental Physics University of Bremen www.sat.uni-bremen.de. Overview.

E N D
OBS 13: Measuring Upper Tropospheric Humidity with Operational Microwave Satellite Sensors COST 723 UTLS Summerschool Cargese, Corsica, Oct. 3-15, 2005 Stefan A. Buehler Institute of Environmental Physics University of Bremen www.sat.uni-bremen.de
Overview • Water vapor in the Earths radiation balance • Operational meteorological microwave satellite instruments (AMSU-B) • AMSU-B measurements of upper tropospheric water vapor • Comparison with radiosonde measurements • Temperature uncertainty and supersaturation • The radiative transfer model ARTS • Summary Cited papers can be found at http://www.sat.uni-bremen.de
Overview • Water vapor in the Earths radiation balance • Operational meteorological microwave satellite instruments (AMSU-B) • AMSU-B measurements of upper tropospheric water vapor • Comparison with radiosonde measurements • Temperature uncertainty and supersaturation • The radiative transfer model ARTS • Summary
Earths Radiation Balance Sun Earth Incoming Shortwave Radiation Outgoing Longwave Radiation OLR
Earths Radiation Balance λEλ [normalized] Wavelength [μm] (Wallace und Hobbs, `Atmospheric Science', Academic Press, 1977.) • Radiative equilibrium temperature: -18°C • Global mean surface temperature: +15°C • 34 K natural greenhouse effect
Clear-Sky OLR Spectrum • A lot of the radiation comes from the UT • Water vapor and CO2 are the most important greenhouse gases
Jacobians [10-14W Hz-1 sr-1 m-2]
[10-14W Hz-1 sr-1 m-2] [10-14W Hz-1 sr-1 m-2] [10-14W Hz-1 sr-1 m-2] [10-14W Hz-1 sr-1 m-2]
Important Altitude Range [10-14W Hz-1 sr-1 m-2] MLS • OLR is sensitive to changes of humidity in the upper troposphere, where it is difficult to measure. • Sensitivity peak below TTL.
H2O is a stronger greenhouse gas than CO2 Impact on Tropical OLR 15% change in humidity = double CO2 - (for a tropical atmosphere) • Higher surface temperature = more evaporation positive feedback. (Buehler et al., JQSRT, submitted 2005)
The Water Vapor Feedback • Convection and cyclones transport moisture into the UT (see lectures of Heini Wernli and Andrew Gettelman) • Ascending air is dried by condensation processes • High spatial and temporal variability • Residence time of water substance ~10 days
Variability of Clear-Sky OLR • Paradox: More humidity = more OLR! Simulated OLR [W/m2] Total water vapor [mm] (Buehler et al., Q. J. R. Meteorol. Soc., submitted 2005)
Variability of Clear-Sky OLR CERES Data Simulated OLR [W/m2] Radiosondes • High temperature correlated with high humidity • Positive temperature signal outweighs negative humidity signal • Expected, otherwise runaway greenhouse effect • Water vapor signal strongest in the tropics • Simulated radiances agree with CERES OLR data Surface temperature [K] (Buehler et al., Q. J. R. Meteorol. Soc., submitted 2005)
Variability of Clear-Sky OLR CERES Data Simulated OLR [W/m2] Radiosondes Delta OLR [W/m2] • (Buehler et al., Q. J. R. Meteorol. Soc., submitted 2005) • No strong temperature variations in the tropics • Temperature and Water Vapor variations are both important for clear-sky OLR
Climate GCMs indicate that the feedback is positive. • A large part (about half) of the warming predicted by models for a CO2 rise is due to the water vapor feedback (Held and Soden, Annu. Rev. Energy Environ., 2000). • The UT is an important altitude region for this feedback, but humidity there is poorly known. • Radiosonde measurements: • Low spatial coverage • Poor data quality in the UT • Infrared satellite measurements: • Good global coverage, but affected by clouds • Clear sky bias • Microwave satellite measurements (today) • Radio occultation (Friday, OBS 16) • Ice clouds play also an important role in the UT radiation balance (Friday, OBS 15)
Big differences between the different data sets, for example: +/-15 %RH difference between IR satellite and radiosonde = 40% relative difference in humidity, as RH values are low in the UT. Comparison: Radiosondes ↔ Infrared Satellite Data (Soden and Lanzante, JGR 1996) Problem: Large discrepancies, true climatology unknown (see e.g. SPARC UTLS H2O Assessment)
Overview • Water vapor in the Earths radiation balance • Operational meteorological microwave satellite instruments (AMSU-B) • AMSU-B measurements of upper tropospheric water vapor • Comparison with radiosonde measurements • Temperature uncertainty and supersaturation • The radiative transfer model ARTS • Summary
Microwave Satellite Data • SSM-T2 since 1995 • AMSU-B since 1999 • Passive microwave instruments (measuring thermal radiation from the atmosphere) • Less affected by cloud than infrared • Well calibrated
AMSU-B • Cross-track scanner • 90 pixels per scan line • Outermost pixels 49° off-nadir • Swath with ≈ 2300 km • Global coverage twice daily • 16 km horizontal resolution (at nadir)
AMSU-B Channels Water vapor Oxygen (Details:John and Buehler,GRL, 31, L21108, doi:10.1029/2004GL021214)
AMSU-B Channels Water vapor Oxygen (Figure by Viju O. John)
AMSU-B Jacobians 20 19 18 19 20 ARTS Simulation, Atmosphere: Midlatitude-Summer (Figure by Viju O. John)
Jacobians depend on Atmospheric State (Figures by Viju O. John) • Measurement not in TTL, but below • Altitude where OLR is very sensitive to H2O changes
AMSU-B Data (Channel 18) Dry areas in the UT (NOAA 16, Channel 18, 15.6.2004. Figure: Oliver Lemke)
Overview • Water vapor in the Earths radiation balance • Operational meteorological microwave satellite instruments (AMSU-B) • AMSU-B measurements of upper tropospheric water vapor • Comparison with radiosonde measurements • Temperature uncertainty and supersaturation • The radiative transfer model ARTS • Summary
Retrieving humidity usually requires a priori, problematic for climate applications • Humidity Assimilation can destroy information on absolute value due to the bias corrections applied (compare lecture by Francois Bouttier) • Solution: Look for a humidity product that is related as closely as possible to the radiances
Regression UTH Retrieval • UTH = Jacobian-weighted relative humidity ≈ mean relative humidity between 500 and 200 hPa • Simple relation: ln(UTH) = a + b Tb • Determine a and b by linear regression with training data set • Details: Buehler and John, JGR, 2004 • Method originally invented by Brian Soden for IR data.
Coefficients independent of training data set • Basically another unit for radiance • Other humidity data must be processed in same way for comparison
AMSU UTH-Climatology (AMSU-B, Channel 18, NOAA 15, Winter 1999-2000. Figure by Mashrab Kuvatov) With deep apologies to Mark Baldwin for the weird color scale...
Walker Circulation during La Nina NOAA 15 AMSU-B UTH DJF 99-00 500-200 hPa HALOE, 82 hPa Gettelman et al, 2001, J. Clim
Comparison with an Infrared Climatology Infrared UTH (1981-1991), Soden and Bretherton, JGR, 101 (D5), 9333-9343, 1996 Microwave UTH (AMSU-B, NOAA 16, 2002), Mashrab Kuvatov
UTH, AMSU-B, Channel 18, NOAA 16, 2002 Difference with and without cloud filter (Figures by Mashrab Kuvatov)
Overview • Water vapor in the Earths radiation balance • Operational meteorological microwave satellite instruments (AMSU-B) • AMSU-B measurements of upper tropospheric water vapor • Comparison with radiosonde measurements • Temperature uncertainty and supersaturation • The radiative transfer model ARTS • Summary
Finding Matches • Define target area (radius 50 km) • Compare mean satellite value to radiosonde • Take standard deviation σ50kmas measure of sampling error
Large variability in σ50km • Lowest values consistent with nominal radiometric noise
Error Model Sources of error: • Radiometric noise of the AMSU measurement • Sampling error due to atmospheric inhomogeneity • Radiosonde measurement error in humidity and temperature • RT model error • AMSU calibration error χ2 tests show that C0 can be taken as a global constant with a value of 0.5K.
Results • Non-unity radiance slope • Possible reasons: • RT model • AMSU • Radiosonde • Increasing radiosonde dry bias under very dry conditions (Buehler et al., JGR, 109, D13103, doi:10.1029/2004JD004605, 2004)
Comparison for a Different Sensor • Kem, Russia (64N, 34E) • Goldbeater’s skin type sondes • very large wet bias (expected from Soden and Lanzante, JGR, 1996 ) (Figure by Viju O. John)
Comparing different Radiosonde Stations • 40 European stations • Sonde data from BADC (John and Buehler, ACP, 2005)
Comparing different Radiosonde Stations (John and Buehler, ACP, 2005) • General dry bias (expected for Vaisala sensor) • Apparently erratic jumps can be understood by sensor and/or procedure changes for individual stations • Information about stations not readily available • Mystery: UK stations have less dry bias, although the are supposed to use similar sensors • See also poster by T. Suortti
Overview • Water vapor in the Earths radiation balance • Operational meteorological microwave satellite instruments (AMSU-B) • AMSU-B measurements of upper tropospheric water vapor • Comparison with radiosonde measurements • Temperature uncertainty and supersaturation • The radiative transfer model ARTS • Summary
Supersaturation in UARS-MLS Data exponential drop-off
Gaussian T distr. Non-Gauss RH distr.
MLS Data Effect of 2K T uncertainty Some of the observed supersaturation can be due to temperature uncertainties (Buehler and Courcoux, GRL, 2003).
Overview • Water vapor in the Earths radiation balance • Operational meteorological microwave satellite instruments (AMSU-B) • AMSU-B measurements of upper tropospheric water vapor • Comparison with radiosonde measurements • Temperature uncertainty and supersaturation • The radiative transfer model ARTS • Summary
RTTOV • Fast RT model • Freely available from Eumetsat NWP SAF • Already configured for most meteorological sensors • Biases compared to more accurate ARTS model (see Poster by Nathalie Courcoux) • Not used for the calculations in this lecture
Public Domain Program, developed together with Chalmers University, Göteborg and University of Edinburgh. Two branches: ARTS-1-0: Clear-sky ARTS-1-1: with cloud scattering
RT Workshop 2004 Radiative Transfer Core Developers (2005) • Development and workshops since 1999. RT Workshop 2005