Download
1 / 26
260 likes | 396 Views
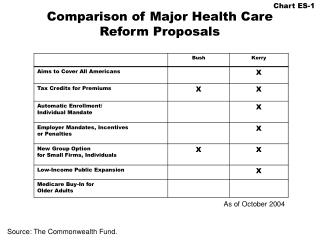
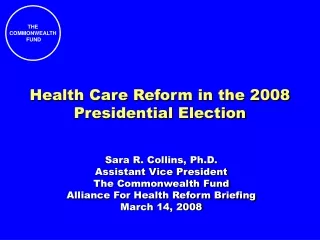
Health Care Reform Proposals of the 2008 Presidential Election. Sara R. Collins, Ph.D. Assistant Vice President The Commonwealth Fund The National Congress on the Un and Under Insured Washington, D.C. December 11, 2007.

E N D
Health Care Reform Proposals of the 2008 Presidential Election Sara R. Collins, Ph.D. Assistant Vice President The Commonwealth Fund The National Congress on the Un and Under Insured Washington, D.C. December 11, 2007
Why Does the Current Health Insurance System Fail to Promote High Performance? • Access to care is unequal • Poor access to care is linked to poor quality • Care delivery is inefficient • Fragmented health insurance system makes it difficult to control costs • Financing of care for uninsured and underinsured families is inefficient • Positive incentives in benefit design and insurance markets are lacking
Employers Provide Health Benefits to More than 160 Million Working Americans and Family Members Numbers in millions, 2006 Uninsured 47.0 (16%) Uninsured 46.4 (18%) Employer 163.3 (55%) Employer 160.8 (62%) Military 3.4 (1%) Military 3.4 (1%) Individual 16.0 (5%) Individual 15.8 (6%) Medicaid 27.9 (9%) Medicaid 27.9 (11%) Medicare 39.1 (13%) Medicare 6.4 (2%) Total population = 296.7 Under-65 population = 260.7 Source: S. R. Collins, C. White, and J. L. Kriss, Whither Employer-Based Health Insurance? The Current and Future Role of U.S. Companies in the Provision and Financing of Health Insurance (New York: The Commonwealth Fund, Sept. 2007).Data: Current Population Survey, Mar. 2007.
Employer-Provided Health Insurance, by Income Quintile, 2000–2006 Percent of population under age 65 with health benefits from employer Source: E. Gould, The Erosion of Employment-Based Insurance: More Working Families Left Uninsured,EPI Briefing Paper No. 203 (Washington, D.C.: Economic Policy Institute, Nov. 2007).
States’ Income Eligibility Levels for Medicaid/SCHIP for Children States’* Medicaid/SCHIP eligibility levels for children (% of federal poverty level) Source: Kaiser Family Foundation, “Income Eligibility Levels for Children’s Separate SCHIP Programs, 2006” available online at http://www.statehealthfactsonline.org, accessed on February 9, 2007.
States’ Income Eligibility Levels for Medicaid/SCHIP for Parents States’* Medicaid/SCHIP eligibility levels for parents (% of federal poverty level) Source: Kaiser Family Foundation, “Income Eligibility for Parents applying for Medicaid, 2006” available online at http://www.statehealthfactsonline.org, accessed on February 9, 2007.
States’ Income Eligibility Levels for Medicaid/SCHIP for Non-Parent Adults States’* Medicaid/SCHIP eligibility levels for non-parent adults (% of federal poverty level) Source: State Coverage Initiatives, current as of October 2006.
Individual Market Is Not an Affordable Option for Many People Source:S.R. Collins, J.L. Kriss, K. Davis, M.M. Doty, A.L. Holmgren, Squeezed: Why Rising Exposure to Health Care Costs Threatens the Health and Well-being of American Families, The Commonwealth Fund, September 2006.
1999–2000 2005–2006 NH NH ME WA NH VT ME WA VT ND MT ND MT MN MN OR NY MA WI OR MA NY ID SD WI RI MI ID SD RI WY MI CT PA WY NJ CT IA PA NJ NE IA OH DE IN NE OH NV DE IN IL MD NV WV UT VA IL MD CO DC WV UT VA KS MO KY CA CO DC KS MO KY CA NC NC TN TN OK SC AR OK AZ NM SC AR AZ NM MS GA AL MS GA AL TX LA TX LA FL FL AK AK 23% or more HI HI 19%–22.9% 14%–18.9% Less than 14% 47 Million Uninsured in 2006, Increase of 8.6 Million Since 2000, Adults Under-65 Accounted for Most of the Increase U.S. Average: 20.1% U.S. Average: 17.3% Source: J. C. Cantor, C. Schoen, D. Belloff, S. K. H. How, and D. McCarthy, Aiming Higher: Results from a State Scorecard on Health System Performance (New York: The Commonwealth Fund, June 2007). Updated Data: Two-year averages 1999–2000, updated with 2007 CPS correction, and 2005–2006 from the Census Bureau’s March 2000, 2001 and 2006, 2007 Current Population Surveys.
1999–2000 2005–2006 NH ME WA NH VT ME WA VT ND MT ND MT MN MN OR NY MA WI OR MA NY ID SD WI RI MI ID SD RI WY MI CT PA WY NJ CT IA PA NJ NE IA OH DE IN NE OH NV DE IN IL MD NV WV UT VA IL MD CO DC WV UT VA KS MO KY CA CO DC KS MO KY CA NC NC TN TN OK SC AR OK AZ NM SC AR AZ NM MS GA AL MS GA AL TX LA TX LA FL FL AK AK 16% or more HI HI 10%–15.9% 7%–9.9% Less than 7% Percent of Uninsured Children DeclinedSince Implementation of SCHIP, But Gaps Remain U.S. Average: 11.3% U.S. Average: 12.0% Source: J. C. Cantor, C. Schoen, D. Belloff, S. K. H. How, and D. McCarthy, Aiming Higher: Results from a State Scorecard on Health System Performance (New York: The Commonwealth Fund, June 2007). Updated Data: Two-year averages 1999–2000, updated with 2007 CPS correction, and 2005–2006 from the Census Bureau’s March 2000, 2001 and 2006, 2007 Current Population Surveys.
Adults Without Insurance Are Less Likelyto Be Able to Manage Chronic Conditions Percent of adults ages 19–64 with at least one chronic condition* *Hypertension, high blood pressure, or stroke; heart attack or heart disease; diabetes; asthma, emphysema, or lung disease. Source: S. R. Collins, K. Davis, M. M. Doty, J. L. Kriss, A. L. Holmgren, Gaps in Health Insurance: An All-American Problem, Findings from the Commonwealth Fund Biennial Health Insurance Survey (New York: The Commonwealth Fund) Apr. 2006.
Previously Uninsured Medicare Beneficiaries With History of Cardiovascular Disease or Diabetes Have Much Higher Self-Reported Hospital Admissions After Entering Medicare Than Previously Insured Number of hospital admissions per 2-year period Source: J. M. McWilliams, et al., “Use of Health Services by Previously Uninsured Medicare Beneficiaries,” NEJM 357;2, Jul 12 2007.
Cost-Related Access Problems, by Deductible Percent of adults ages 19–64 insured all year with private insurance Source: S.R. Collins, et al., Squeezed: Why Rising Exposure to Health Care Costs Threatens the Health and Well-being of American Families, The Commonwealth Fund, September 2006.
Many Americans Have Problems Paying Medical Bills or Are Paying Off Medical Debt Percent of adults ages 19–64 who had the following problems in past year: *Includes only those who had a bill sent to a collection agency when they were unable to pay it. Source: S. R. Collins, K. Davis, M. M. Doty, J. L. Kriss, and A. L. Holmgren, Gaps in Health Insurance: An All-American Problem, The Commonwealth Fund, April 2006.
One-Quarter of Adults With Medical Bill Burdens and Debt Were Unable to Pay for Basic Necessities Percent of adults ages 19–64 with medical bill problems or accrued medical debt: Source: S. R. Collins, K. Davis, M. M. Doty, J. L. Kriss, and A. L. Holmgren, Gaps in Health Insurance: An All-American Problem, The Commonwealth Fund, April 2006.
Americans Spend More Out-of-Pocket on Health Care Expenses Total health care spending per capita United States France Canada a Germany b Australia Netherlands OECD Median a Japan New Zealand Out-of-pocket spending per capita a2003 b2003 Total Health Care Spending, 2002 OOP Spending Source: The Commonwealth Fund, calculated from OECD Health Data 2006.
16 Million Adults Under Age 65 Were Underinsured in 2005 Uninsured during the year 47.8 (28%) Insured, not underinsured 108.6 (63%) Underinsured 16.1 (9%) Adults 19–64 Note: Underinsured defined as having any of three conditions: 1) annual out-of-pocket medical expenses are 10% or more of income; 2) among low-income adults, out-of-pocket medical expenses are 5% or more of income; 3) health plan deductibles are 5% or more of income. Source: Michelle M. Doty, Analysis of the Commonwealth Fund Biennial Health Insurance Survey (2005).
Roadmap to Health Insurance for All: Principles for Reform • Builds an essential foundation for quality and efficiency as well as access • Benefits cover essential services with financial protection • Premiums/deductibles/out of pocket costs affordable • Coverage is automatic, stable, seamless • Choice of health plans or care systems • Broad health risk pools; competition based on performance, not risk or cost shift • Simple to administer: lowers overhead costs providers/payers • Minimizes dislocation • Financing adequate/fair/shared across stakeholders
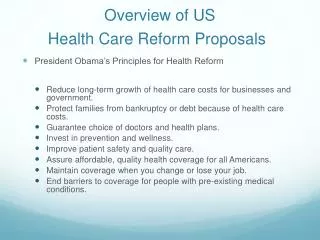
Health Reform and the Presidential Candidates • Leading Democrats: • Mixed private-public group insurance • Shared financial responsibility (government, employers, households), employer & individual mandate • Medicaid/SCHIP expansion • New group insurance “connectors” with private & public plan options like Medicare • Insurance market regulations against risk selection • HIT, prevention, chronic care management, comparative effectiveness, pay for performance, transparency • Finance with repeal/expiration of high-income tax breaks and system reforms • Leading Republicans: • Tax incentives for purchase of individual insurance • Make employer health insurance contributions taxable income to employee • Buy insurance from any state • Greater state flexibility to reallocate Medicaid/SCHIP dollars • Tort reform, transparency, IT, pay for performance, prevention
Design Matters: How Well Do Different StrategiesMeet Principles for Health Insurance Reform? 0 = Minimal or no change from current system; – = Worse than current system; + = Better than current system; ++ = Much better than current system Source: S.R. Collins, et al., A Roadmap to Health Insurance for All: Principles for Reform, Commission on a High Performance Health System, The Commonwealth Fund, October 2007.
Why Not the Best? • Current directions absent policy change: • Costs expected to go to 20% of GDP and uninsured to move up the economic ladder • Aiming higher: Why not the best? • U.S. has the resources and technology • Facing facts can help build consensus
Related Commonwealth Fund Reports • A High Performance Health System for the United States: An Ambitious Agenda for the Next President, The Commonwealth Fund Commission on a High Performance Health System, November 2007. • S. R. Collins, C. Schoen, K. Davis, et al., A Roadmap to Health Insurance for All: Principles for Reform, The Commonwealth Fund Commission on a High Performance Health System, October 2007. • C. Schoen, R. Osborn, M. M. Doty, et al., “Toward Higher-Performance Health Systems: Adults’ Health Care Experiences in Seven Countries, 2007,” Health Affairs Web Exclusive, October 31, 2007. • S. R. Collins, C. White, and J. L. Kriss, Whither Employer-Based Health Insurance? The Current and Future Role of U.S. Companies in the Provision and Financing of Health Insurance, The Commonwealth Fund, September 2007. • J. C. Cantor, D. Bellof, C. Schoen, et al., Aiming Higher: Results from a State Scorecard on Health System Performance, The Commonwealth Fund Commission on a High Performance Health System, June 2007. Visit the Fund at: www.commonwealthfund.org
Acknowledgements Cathy Schoen, Senior Vice President for Research and Evaluation The Commonwealth Fund Karen Davis, President The Commonwealth Fund Jennifer L. Kriss, Program Associate The Commonwealth Fund