Download
1 / 22
230 likes | 388 Views
This framework outlines critical considerations in establishing advertising objectives and measurement systems that inform business decisions. It emphasizes the need for systematic data capturing, insightful communication, and ongoing measurement integration across various vehicles and customer engagement cycles. The approach advocates for detailed comparisons and rigorous attribution to enhance marketing effectiveness. Companies are encouraged to allocate 5-10% of their marketing budget to measurement to ensure organizational alignment, stakeholder buy-in, and the ability to derive actionable insights from advertising performance.

E N D
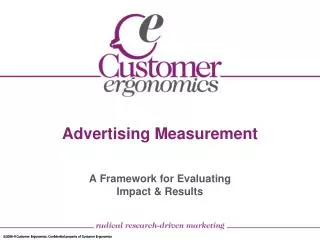
Advertising Measurement A Framework for Evaluating Impact & Results
Agenda • Context • Considerations For Establishing Objectives & Goals • Capturing Information Systematically • Communicating Insights & Learning • A Frame Of Reference • Appendix
Executive Summary • Our measurement approach must readily enable business decisions. • Comparability is essential for evaluating alternatives • Throughout campaign • Across vehicles • By segment • By product • We will need to establish & capture common “Advergraphics” in order to evaluate relative business results • Apples to apples comparisons • Most of the key questions posed by Marketing Leadership require rigorous attribution capabilities • While some metrics will be common and/or we will have the ability to aggregate/disaggregate, others will be unique to a specific vehicle. Some of the metrics will also roll-up and down between advertising and the “Engagement Cycle” dashboard. • Advertising is relatively continuous & so too should be the metrics • On-going sampling or tracking versus static periodic reads
Marketing Dashboards • Best practices of successful marketing dashboards: • Tie measures to strategy – aggregated & disaggregated. • Finance • Customer relationships • Brand health • Internal efficiency • Focus on small set of metrics • Organizational focus • Ensure stakeholder buy-in • People who’s compensation and performance evaluation will be impacted • Metric owners • Finance • Tie to decision making process • Design dashboard to feed the decision-making process • Frame #’s within a qualitative context
In general, companies should spend between 5-10% of their total marketing budget on measurement.1 Marketing Measurement Today Measurement Relative Sophistication Today’s Capabilities Insight Gap ROI Questions % of US Companies2 Lo High 1Source: Boston Consulting Group & Millward Brown 2Source: Marketing Leadership Council
Advertising Response Curves By Product • Financial Services has one of the most challenging consumer response curves1 • The complexity of the decision-making process, financial magnitude & the extraordinary influence of external factors are certainly some of the many contributors to this. Impulse Products Personal Care Financial Services Trial Rate Trial Rate Trial Rate % Consumer Awareness % Consumer Awareness % Consumer Awareness Source: Millward Brown
Response Curves By Vehicle • The same weight produces different patterns in awareness build and decay Magazine % Awareness TV TV GRPs MagazineGRPs Time Source: Millward Brown
Advertising Effectiveness Framework • Clients are spending a significant amount of money on advertising and needs measurement insights in order to optimize the impact of these expenditures. • The Marketing Leadership Team has a need and desire to begin evaluating advertising effectiveness. Key Question:How Might We Think About Evaluating Advertising? 1. Establishing Clear Objectives & Goals 2. Capturing Information Systematically 3. Communicating Insights & Learning
Advertising Objectives & Goals • There are many considerations which need to be taken into account when establishing objectives & goals for an individual advertisement and they may vary based upon the strategic intent of each campaign. • Specify which part of the customer engagement cycle the advertisement is striving to influence • Establish brand objectives (if any) as well as setting specific product objectives • Create/reinforce or change • Perception or behavior • Select a specific target audience • Prospect or customer • Emerging, Engaged, Established, High Net Worth, Active Trader • Understand the context of the campaign as well as the marketplace • Integrated stand alone • Competitive activity • Leading economic indicators & stock market performance • Create the learning plan • Rigorous test design • Data requirements • Analytic framework
Vehicle Impact Varies Across Engagement Cycle As the strategy shifts from expansion towards acquisition, the marketing measurement and infrastructure must evolve. Customer EngagementCycle Consideration Inquiry Investment Expansion Awareness Vehicle • Breakthrough • Relevance • Differentiate • Inform • Activate • Engage Objectives
Advertising metrics will need to span the “Engagement Cycle” and serve as inputs to modeling. End-to-End Measurement TIME Advertising Cycle Exposure Perception Message Immediate Relevance Credibility Invest Experience Interest Status Salience Use/Interaction Memory Enhancement Brand Interaction Metrics • An additional challenge is accounting for the “cumulative” effect of advertising as well as “latency” – Ad impressions accumulate to form brand equity. • As relevance increases so does the time horizon for which the advertising has an impact. • Enhancement is the interaction between experience & expectations where associations are elevated beyond purely functional attributes to beliefs bonding.
Capturing Information • A “Cradle To Grave” approach is required and the measurement metrics and methodology need to be consistent throughout Advertisement Development Execution Evaluation • Ad strategy & theme • “What” • Early in creative process • Qualitative & Quantitative • May be iterative; pre & post production • Standardized questions – “How” • Main message • Persuasiveness • Likes/dislikes • Clear action standards developed in advance • Precisely specified target market • Evaluating copy & vehicles (integrated campaign) • Intercept interviews • Branch • Call center • Web Site • Standardized questions • Communication clarity • Relevance • Appropriateness • Likelihood of action • Tracking • Enjoyment • Business results • Return on marketing investment* (ROMI) • CPI • CPA • Etc. • Brand imagery & equity • Comparison to objectives • Media execution TIGHT LINKAGE • Awareness Index • Persuasion • Imagery • Media Plan • Recall • Message Retention • *Caution: Using ROI as a key performance metric for marketing is dangerous because: • It gives excessive importance to the “I” • Is easier to achieve by reducing costs than increasing revenue • Leads to lower marketing spending and sub-optimal, relative to goals, performance Source: Marketing Science Institute, “The Long & Short View of Marketing Metrics”, Tim Ambler
Integrated Advertising Measurement • Holistic advertising measurement is an on-going cycle of testing & learning which requires considerable cross-team collaboration. MRD • Qualitative & Quantitative Research • Brand Equity Brand Positioning • Response Modeling • Customer Segmentation Development • Performance Measurement • Concept Testing Measurement Objectives In-Market Monitoring Communication Strategy Evaluation Diagnosis • Execution Insights • Tracking Communication Assessment • Pre-Test Copy/Execution Customer Data Mart Project Point of Entry
Advergraphics • To enable robust analytics, companies must capture common “AdverGraphics” across all of its advertising – A process challenge • “AdverGraphics” -- Demographic type characteristics which describe in detail the nature of the ad itself AND all individual placements Advertisement Broadcast Placement Print Placement • Size – inches & % of page – Print • Color or B&W –Print • Lenth of ad -- Broadcast • Proportion brand: product • How many products • Which products • Message category • Proof points • Call to action: y/n, desired response channel(s) & #s/URLs • Pre-test scores • Target audience; prop/cust., EM/EN/ES/AT/HNW; SD/V/D Planning doc • Target engagement cycle stage • Behavioral objective • Strategic intent • Creative name, Oasis # • Development cost • Incentive or promotion: y/n& specific offer • Integrated campaign: y/n & other vehicles • Show name/program • Media type: network, spot, cable, etc. • Position within commercial break: first, last, other • Daypart • Audience: audited impressions & demographics • Audited GRP’s • Run date(s) • Cost of airing • Network TV; Ad position & Audited Audience MEETING WITH ARNOLD TO REVIEW THEIR DONOVAN SYSTEM - Much of his type of data captured there Network TV has much more robust data capture than other broadcast vehicles • Name • Publication type • Newspaper: financial, national, regional • Magazine; business, lifestyle, etc. • Frequency; daily, weekly, monthly, quarterly • Publications Format; size, color/B&W • Audited circulation • Audited GRP’s • Publication demographics • Location within publication (timing varies) • Drop date • Cost of insertion • Need to evaluate the option of incorporating syndicated data such as Starch/Samms, MRI/Monroe Mendleson, Neilsen, Arbitron & potentially others • Currently available • Planned or readily incorporated • Likely, pending detailed MRD questionnaire review
Advergraphics • Internet AdverGraphics will vary somewhat based upon which Internet vehicles are used • In addition to the standard advertisement AdverGraphics outlined on the previous page, for Internet advertising we will also want to capture the degree of motion and the level of graphic delivery (flash & HTML) Email Banner Paid Search Engine Inclusion • Order in which Co is served up • Page location where it is placed • Ad or link • Size • Raw # of times served up • Proportion of click throughs • Subject line • Number of recipients • Response rate • HTML, Plain Text or both • Size • Flash or other motion; y/n • Triggers for serving • Number of banner ads served • Proportion of click throughs
Attribution • Attribution will manifest itself differently across the continuum of measurement options, however planned & systemic is what will be required to answer the insightful questions being asked by Marketing Leadership Activity Measurement Activity & Analyses Measurement Planned & Systemic Measurement • Scale the Call Center pilot • Can answer some of the “What” happened • Develop hypotheses about “Why” • Ease of implementation • Short lead time to implementation • Can’t generalize learnings • Based entirely on consumer recall which has been empirically proven as unreliable • Assumes same response profile across channels • Institute source coding on all marcom • Can answer all of “What” & some of “Why” • Precise understanding of market drivers • A frame of reference for interpreting relative performance • Can’t generalize learning • Ignores the cumulative effect of advertising & attributes impact entirely to the most recent marketing event • Limited understanding of interaction between marketing vehicles • Institute source coding on all marcom • Establish business rules for attribution across touchpoints • Can answer all of the IMM questions; “What, Why & How” • Can generalize & institutionalize learnings • Able to quantify interactions between vehicles • Remains dependent upon rigorous test design • Must capture detailed “AdverGraphics” Characteristics Advantages Disadvantages
Insight By Vehicle • A Combination of Media Generally Has A Greater Impact Than Any Individual Media Type. TV Radio Print • Creative needs to be brand linked • Awareness responds to GRPs immediately • Position w/in commercial break • Flighting best when dispersed across network/cable/spot & daypart • Need 100 GRPs/wk to breakthrough • Synergistic w/other media particularly when there’s a schedule overlap • Impact per GRP tends to be lower than TV • Best if enjoyable and well branded • Benefits greatly from synergies w/TV and can extend TV campaign • High level of targeting • Print w/TV more likely to result in active consideration than TV alone • Active consumption; fast wear out of individual execution • Works best where reader is interested in category Otherwise need strong creative hook to overcome filters • Messages perceived as more credible & less pushy • Interest & prestige can be heightened by context Internet Public Relations Event/Sponsorship • Active goal-seeking medium can help ads be very effective • Recall on par w/TV1 • Can be effective even without click-through • ‘Rich Media’ #2 x’s more effective than banners • High level of targeting & direct response • Possible irritation • Independent source creates greater credibility • Works very effectively as a multiplier for other messages • Tight linkage between event message and brand • Can be effectively leveraged when part of brand multimedia campaign • TV sponsorship can be as powerful as TV advertising Source: Millward Brown, Real-Time Marketplace Feedback
Differences Between Media Magazines TV Advertising Exposure Passive Active/selective Product Category Effect Little Large Attention-Getting Wearout Little Rapid How Stored In Memory ST as Ad LT as Fact Need For Creative “Hook” Less High Recall of Visual Elements Well remembered Less well remembered Mental Processing Little High degree Source: Millward Brown
Brand Health Metrics Consumer Engagement Cycle Awareness Consideration Inquiry Investment Expansion • Top-of-mind awareness • Presence • Aided awareness • Familiarity • Competitive comparison • Share of voice • Effective share of voice • Hedonic evaluation • Understand positioning • Recall key copy points • Perceived rational attributes & benefits • Functional • Process • Consideration • Relevance • Cognitive responses & judgments • Factual recall • Perceived emotional attributes & benefits • Purchase intent • Brand Portfolio Impact • Family • Category • Current usage • Usage trend • Cross-utilization • Frequency of consumer interaction • Brand strength • Product performance • Attributes • Advantages • Deficits • Customer service satisfaction • Customer loyalty • Overall • Key proposition elements • Likelihood of switching • Next month • With incentive • Affinity • Relationship • Bonded • Brand Advocacy • Currently available • Planned or readily incorporated • Likely, pending detailed MRD questionnaire review Brand Adv Product Adv Measurement Considerations: Objective Information & Action Favorable Attitudes Cognitive Responses &Consumer Judgments “Brand Image & Equity”* Factual Data & Recall “Brand Salience/Relevance” *Note: Brand equity has a strong linear relationship for the next 2 years with Market Share (R2=5) & EBITDA (R2=.7) Source: Customer Ergonomics Analyses & MSI; “The Long & Short View of Marketing Metrics”, Tim Ambler
Individual Advertisement Metrics Consumer Engagement Cycle Awareness Consideration Inquiry Investment Expansion • Recall key elements • Content playback • Brand linkage • Communication clarity • Ease of understanding • Awareness index • Cut Through • Branded memorability • Enjoyment • Involvement • Effective GRPs/TRPs • Effective “Share of Voice” • Relative perception of the amt. of advertising • Interest • Total Communication • Hedonic • Relevance • New news • Difference/ uniqueness • Believability • Trust/ confidence • Reasonable fees/value • Corp. values & ethics • Persuasion • Unaided & aided consideration • Perceived Advantage • Satisfaction w/customer service • Likelihood to take action; call, click, or visit • Intention to invest • Previous investment experience • Knowledgeable Sales Reps • Perceived advantage • “Relative” wealth • Brand affinity • Number of vehicles & channels • Frequency of interaction • Perception of relationship • Confidence & Security • External Factors • Personal • Fidelity • Currently available • Planned or readily incorporated • Likely, pending detailed MRD questionnaire review
Unique Internet & Site Visit Metrics Consumer Engagement Cycle Awareness Consideration Inquiry Investment Expansion • Page & banner impressions • Unique visitors – Cookies 1 machine, logins for multiple pc’s • Total visitors • Pgs viewed/visit • Effective GRP’s • Advertising & promotion click through • Visitor origin - Search engine - Paid Inclusion - Referral site • F.S. sites visited • Time spent/ page - calculated • Visitors by ISP • Browser used - @ IP address level • Downloaded pages • Tool usage • Site registration – bare minimum • Repeat visitors • Topics/categ visited/session or /visitor • Page exited from • Proportion inquiries via Web • Trades • Value of trade • Opt-ins • Site registration – In depth & complete • Visit frequency • Personalized Home Page • Alerts set up • Elapsed time between visits • Time per visit • Pages viewed per visit • Multi-channel customers • Many of the MRD metrics exclude Internet customers. This research will need to be supplemented or revised to reflect these customers too. • Need to further explore syndicated metrics as Financial Services frame of reference; ComScore, Nielsen Net Ratings, Jupiter Media Matrix • Currently available • Planned or readily incorporated • Likely, pending detailed MRD questionnaire review All metrics #/%/$
Communicating Insights • Communicating Insights Drives Organization Learning • Sequencing analytics • Quick read vs. depth • Standardized • Deep dive • Establishing a frame of reference for objective interpretation • Normative database • Outside your industry • Creating institutional knowledge • Best practices