Download
1 / 51
520 likes | 771 Views
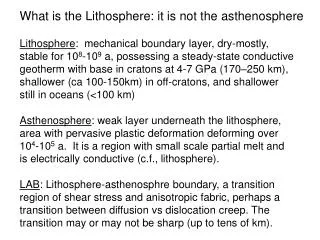
What is the Lithosphere: it is not the asthenosphere.

E N D
What is the Lithosphere: it is not the asthenosphere Lithosphere: mechanical boundary layer, dry-mostly, stable for 108-109 a, possessing a steady-state conductive geotherm with base in cratons at 4-7 GPa (170–250 km), shallower (ca 100-150km) in off-cratons, and shallower still in oceans (<100 km) Asthenosphere: weak layer underneath the lithosphere, area with pervasive plastic deformation deforming over 104-105a. It is aregion with small scale partial melt and is electrically conductive (c.f., lithosphere). LAB: Lithosphere-asthenosphre boundary, a transition region of shear stress and anisotropic fabric, perhaps a transition between diffusion vs dislocation creep. The transition may or may not be sharp (up to tens of km).
lithosphere-asthenosphere boundary (LAB) properties crust mantle w/ melt Fischer et al (2010, Ann Rev)
Mantle Crust
Composition of the lithospheric mantle Approaches geophysics: seismology, gravity, heat flow, tectonics (rheology, deformation, uplift, erosion) geochemistry: petrography, elemental, isotopic Sampling the lithospheric mantle Approaches geophysics: 103 – 106 meters geochemistry: 10-3 – 10-6 meters - 6 to 12 orders of magnitude difference
Why study composition of the CLM? • - Place constraints on the timing and tectonic setting for the formation of continents & their roots • - Examine consequences of the Earth’s secular evolution • - Test models of basaltic source regions • - Characterize the inventory of elements in an Earth reservoir
The different Lithospheres one example LID Chemical Mechanical Thermal Seismological Tectosphere Bottom: asthenosphere (LAB) Top: MOHO (seismic) petrologic break Oceanic Continental: cratonvs off-craton
Where are the cratons and off-cratons Pearson and Witting (2008, GSL)
Where are the cratons and off-cratons Lee et al (2011, Ann Rev)
Growth of Lithospheric Mantle (LM) • Mostly linked to crust production • Different in oceanic vs continental setting • Oceanic: crustal growth in divergent margin settings, with LM growth via lateral accretion of refractory peridotite, followed by conductive cooling of deeper lithosphere • Continental: mostly convergent margin tectonic growth, with some intraplate contributions, LM grows by accretion of refractory diapirs
Oceanic & Continental Crusts 60% of Earth’s surface consists of oceanic crust
Oceanic lithosphere cools, thickens and increases in density away from the ridge Increasing density of lithosphere with age leads to progressive subsidence (age-depth relationship)
Depth Seafloor subsidence & heatflow reflect progressive thickening of lithosphere with age D(m) = 2500 +350t1/2 q = 480/t1/2 Heatflow Wei and Sandwell 2006 Tectonophysics
Continental Lithospheric Mantle CLM growth models Lee et al (2011, Ann Rev)
Heat production in the Lithosphere • - Heat Producing Elements (HPE): K, Th, U • - Continental Surface heat flow (Q) • Craton 40 mW m-2 Off craton 55 mWm-2 • - Near surface heat production • - Heat production versus depth • - Concentration of HPE in Lithospheric Mantle?
Earth’s Total Surface Heat Flow 40,000 data points Conductive heat flow measured from bore-hole temperature gradient and conductivity Surface heat flow 463 TW (1) 472 TW (2) mW m-2 (1) Jaupart et al (2008) Treatise of Geophys. (2) Davies and Davies (2010) Solid Earth
Earth’s surface heat flow 46 ± 3 (47 ± 2) Mantle cooling (18±10 TW) Crust R* (7±3 TW) Core (9±6 TW) Mantle R* (13±4 TW) *R radiogenic heat (0.4 TW) Tidal dissipation Chemical differentiation after Jaupart et al 2008 Treatise of Geophysics ± are 1s.d. estimates
linear relation between heat flow and radioactive heat production • - characteristic values for tectono-physiographic provinces. (b) Q = Q0 + Ab (Q0) (A) Birch et al., (1968)
Q = Q0 + Ab 1 Baltic Shield 2 Brazil Coastal 3 Central Australia 4 EUS Phanerozoic 5 EUS Proterozoic 6Fennoscandia 7 Maritime 8 Piedmont 9 Ukraine 10 Wyoming 11 Yilgarn Mahesh Thakur & David Blackwell (in press)
Jericho Lac de Gras Torrie Grizzly 0 200 400 600 800 1000 1200 1400 1600 200 400 600 800 1000 1200 1400 1600 Archean lithosphere is thick & cold 0 Kalihari Slave 50 2 100 4 Pressure (GPa) 150 Depth (km) 6 Lesotho 200 Kimberley Best Fit Kalihari Letlhakane 8 250 300 10 Temperature (oC) Temperature (oC) From Rudnick & Nyblade, 1999
Age of CLM Isotope systems NO: U-Pb, Sm-Nd, Rb-Sr, Lu-Hf (incompatible element systems) YES: Re-Os (compatible element systems) Lee et al (2011, AnnRev) Pearson and Witting (2008, GSL)
“Alumina-chron” YangyuanPeridotites, North China Craton PUM TRD (Ga) 0.5 187Os/ 188Os 1.0 1.5 2.0 2.5 Al2O3 (wt. %) Data filter: - No peridotites with less than 0.5 ng/g Os plotted - No samples analyzed by sparging. J.G. Liu et al., 2009; 2011
g Os Hannuoba Peridotites,Central Zone: 1.9 Ga lithosphere 0.132 PUM 2 sigma error < spot size 0.128 187Os/ 188Os 0.124 0.120 Age = 1.94 ± 0.18Ga Initial = 0.1155 ± 0.0008 Initial = 0 0.116 MSWD = 23 0 0.1 0.2 0.3 0.4 187Re/188Os Gao et al., 2002, EPSL
Sm-Nd isotopes do not tell you about the age of the CLM McDonough (1990, EPSL)
Lithospheric Mantle samples: Oc. vs Cont. • On-Cratonxenoliths - Archean • Off-Craton xenoliths* - post-Archean • Massif peridotites - post-Archean • Abyssal peridotites - Phanerozic • Oceanic Massifs - Phanerozic *no compositional distinction in Protoerzoic and Phanerozoc Off-Craton
Mineralogy of the Lithospheric Mantle Olivine * ultramafic mafic Orthopyx Clinopyroxene
Mafic assemblages in the CLM Pyroxenites versus Eclogites - Archean roots have distinctive assemblages - Diversity of d18O values (evidence for recycling) - Probably ~5% by mass in CLM (…squishy #) - Which ones are lower crustal vs those resident in the CLM? …. what is the Moho? Maficlithologies are there, but what to do with them? – they do not dominant CLM chemical budget
Significant findings: - Cratonic roots are melt residues of circa ≤ 30% depletion - Off-cratonic regions are dominantly post-Archean, with no chemical distinction in suites over the last 2.5 Ga - Melt depletion occurred at <3 GPa in all regions - Re-Os system yield robust ages for the CLM that can be correlated with the ages of local surface rocks - No evidence for vertical compositional gradients in the CLM - CLM growth during crustal genesis via residual diapiric emplacement (conductive cooling additions – negligible)
Spinel- facies mineralogy (<70 km)
Garnet- facies mineralogy (>70 km)
Olivine is important Lee et al (2011, AnnRev)
Massif melting trend Off-craton dunite On-craton Prim. Mantle Secular decrease in the ambient mantle temperature – resulted in lower degrees of depletion in the CLM
MaficLithologies pyroxenites eclogites Lee et al (2011, AnnRev)
System is modeled w/ differ ratios of “basalt” + residue = PM • Fe-depletion @ hi melt depletion most bouyant residues Median composition of the CLM * * In Kaapvaal, less so Siberian, much less elsewhere is the CLM OPX-enriched OPX-enrichment is secondary: melt addition or cumulate control
Composition of the CLM: trace elements Treatment of data: non-gaussian distribution average (not a good measure) median (better) log-normal avg (better, will equal mode) Sampling biases: fraction of ultramafic to mafic analytical (below detection (reported?), not measured) geological sampling sampling by geologists infiltration by host magma, weathering of xenoliths Is it an enriched mantle region? - mantle metasomatism? - source of basalts?
Compatible to mildly incompatible elements Di = Ci in residue/Ci in melt Di> 1, compatible element Di<1, incompatible element
Heat Producing Elements K, in Peridotites: Lithospheric Mantle
REE composition of CLM (median values only) Primitive mantle normalized LREE-enrichment not strong MREE ~ Primitive Mantle Cratons are strongly HREE-depleted Most depleted is most enriched – not explained feature
Incompatible elements in CLM (median values only) K-depletion - low % partial melt metasom. ~ Primitive Mantle Primitive mantle normalized We can build a complete picture of elements in CLM!
Incompatible element Budget in CLM two-stage production of composition Places limits on heat production in CLM compatibles, never >factor 2 times PM Primitive mantle normalized degree of depletion Constrained from Ca, Al & Ti Th Nb La Nd Zr Ti Yb Ca Sc Al Ga Re Si Fe Mn Mg Ni Ir Integration of major, minor and trace elements
For cratonic & off-cratonic regions - melt depletion is a continuum with no significant differences in time or space (also cannot identify regional distinctions*) - OPX-enrichment is an overprinted feature found in some cratons and is dominant in the Kaapvaalcratonic and immediate off-cratonic area - residual peridotites were produced at <3 GPa and have been overprinted by low degree undersaturated melts - CLM is not a significant chemical reservoir, for the Earth’s budget its compositional contribution = mass contribution (*Large scale perspective, regional features not highlighted)