Download
1 / 32
320 likes | 359 Views
Learn about different satellite orbits, wavelengths, and images in meteorology. Understand the basics of visible and infrared images, land-sea differences, and color enhancements. Gain insights into true-color imagery and water vapor absorption. Discover satellite data sources for geostationary and polar orbiting satellites.

E N D
Satellite Meteorology Basics Scott Lindstrom 20 February 2016
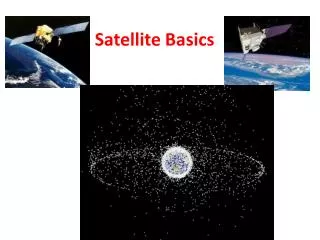
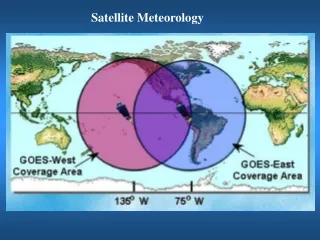
Two kinds of orbits Not To Scale!!!
Two kinds of orbits This is one day’s worth of satellite passes (for Terra)
4 sequential Suomi NPP Passes “descending passes”
In these images – satellite is identified, and wavelength, and day and time
This is a Visible Image : White regions are maxima in solar reflectance This shows reflected light Albedo is highest in white regions: Clouds, Snow, Sand
This is an Infrared Image : White regions are minima in terrestrial radiation This shows emitted energy Cold regions white; warm regions dark
Infrared In both of these images, you can detect the land-sea difference 10.7 mm Visible Conclusion: the atmosphere is transparent to radiation at these wavelengths 0.63 mm
This image is from the same time – but at a different wavelength 6.7 mm…Notice that you cannot see the surface. Why?
This image is from the same time – but at a different wavelength 6.7 mm…Notice that you cannot see the surface. Why? Radiation at 6.7 mm emitted by the surface is absorbed by the atmosphere
This image is from the same time – but at a different wavelength 6.7 mm
Question: If you were looking down from outer space, you would see color. Why don’t you see color in this image?
Question: If you were looking down from outer space, you would see color. Why don’t you see color in this image over the southwest US
Question: If you were looking down from outer space, you would see color. Why don’t you see color in this image over the southwest US
Question: If you were looking down from outer space, you would see color. Why don’t you see color in this image over the southwest US
First image: 0.6465 mm -- the red part of the electromagnetic spectrum
Second image: 0.5537 mm -- the green part of the electromagnetic spectrum
Third image: 0.4656 mm -- the blue part of the electromagnetic spectrum
Satellites have detectors that are sensitive at different wavelengths. This is the near Infrared – 0.86 mm – land/water differences are stark
Here’s the visible for the same time – land/water differences aren’t quite to apparent
Water Vapor molecules absorb energy at 1.38 mm – so you can see the clouds here (cirrus), but not much else.
The ‘window channel’ – 11 mm – the atmosphere is transparent to radiation at this wavelength (but clouds are not!)
Color Enhancements are helpful This channel is in the far Infrared – 11.0 mm – energy that is near the peak emitted by the Earth
Satellites have detectors that are sensitive at different wavelengths This channel – 6.77 mm – is one where water vapor absorbs energy
Color Enhancements are helpful. Bring out the contrast so your eye more easily views it. Here: Yellow is warm (low in atmosphere) and green is cold (high in atmosphere)
Satellite Data Sources • http://www.ssec.wisc.edu/data/ • A link to a variety geostationary and polar orbiting satellites • http://www.ssec.wisc.edu/data/geo/ • Latest Loops from all geostationary imagery! • http://ge.ssec.wisc.edu/modis-today/ • True-color MODIS Imagery over the USA, created daily • http://www.aos.wisc.edu/weather/wx_obs/Satellite.html • US- and Wisconsin-centric imagery and animations • http://www.ssec.wisc.edu/data/1min/ • Link to all 1-minute imagery from GOES-14 • http://re.ssec.wisc.edu • Real Earth – Global Satellite Data in Real Time