Download
1 / 48
480 likes | 577 Views
Dr. Larry Smarr discusses the impact of ICT on GHG emissions, campus testbeds exploring tradeoffs, and the role of ICT in reducing climate change. Explore the potential of ICT in lowering global emissions and the challenges it faces.

E N D
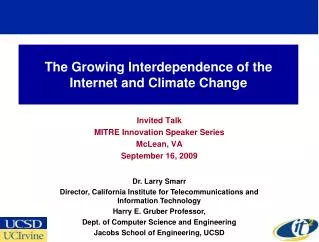
The Growing Interdependence of the Internet and Climate Change Invited Talk MITRE Innovation Speaker Series McLean, VA September 16, 2009 Dr. Larry Smarr Director, California Institute for Telecommunications and Information Technology Harry E. Gruber Professor, Dept. of Computer Science and Engineering Jacobs School of Engineering, UCSD
The global Information and Communication Technology (ICT) industry produces GHGs equivalent to that produced by the aviation industry (~2-3 %). Furthermore, the ICT sector's emissions will nearly triple, in a business as usual scenario, from 2002 to 2020. On the other hand, the Climate Group estimates that transformative application of ICT to electricity grids, logistic chains, intelligent transportation and building infrastructure, and other social systems can reduce global GHG emissions by ~15%, five times ICT's own footprint! I will discuss three campus testbeds for exploring these complex tradeoffs. The first testbed is the NSF-funded GreenLight Project deployed at UCSD, which creates an instrumented data center allowing for detailed real time data measurements of the critical subcomponents and then making that data publically available on the web, so that the results can guide users who wish to lower the energy cost of computation and storage. The second testbed is the use of dedicated optical networks (operating at 10,000 Mbps) coupled to large tiled walls (with fractions of a billion pixels) and high definition (2 Mpixel/frame) or digital cinema (8Mpixel/frame) as "telepresence" systems for "sewing remote rooms together" as a way to reduce the need for transportation for national or global collaboration. Finally, I will analyze the use of campuses themselves, which are functionally small towns with their own power grids, commuter transportation systems, hospitals, and populations in the tens of thousands and so are at-scale Green IT Living Laboratories of the Greener Future.
ICT Could be a Key Factorin Reducing the Rate of Climate Change Applications of ICT could enable emissions reductions of 15% of business-as-usual emissions. But it must keep its own growing footprint in check and overcome a number of hurdles if it expects to deliver on this potential. www.smart2020.org
I Will Cover Four Topics How Bad is Our Current Climate Situation? How Unusual is the Climate We are Heading Toward? What Role Can ICT Play in Slowing Down the Increase in Greenhouse Gases? What Do We Need to Do to Clean Up ICT’s Greenhouse Gas Emissions?
A Brief Review of Climate Change: The Planet is Already Committed to a Dangerous Level of Warming Temperature Threshold Range that Initiates the Climate-Tipping Earth Has Only Realized 1/3 of theCommitted Warming - Future Emissions of Greenhouse Gases Move Peak to the Right Additional Warming over 1750 Level V. Ramanathan and Y. Feng, Scripps Institution of Oceanography, UCSD September 23, 2008 www.pnas.orgcgidoi10.1073pnas.0803838105
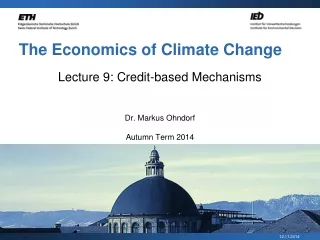
Global Climate Disruption Example:The Arctic Sea Ice “A pervasive cooling of the Arctic in progress 2000 years ago continued through the Middle Ages and into the Little Ice Age. It was reversed during the 20th century, with four of the five warmest decades of our 2000-year-long reconstruction occurring between 1950 and 2000. The most recent 10-year interval (1999–2008) was the warmest of the past 200 decades.” Mean of all records transformed to summer temperature anomaly relative to the 1961–1990 reference period, with first-order linear trend for all records through 1900 with 2 standard deviations Science v. 325 pp 1236 (September 4, 2009)
Global Climate Disruption Early Signs:Arctic Summer Ice is Rapidly Decreasing “The Arctic Ocean will be effectively ice free sometime between 2020 and 2040, although it is possible it could happen as early as 2013.” --Walt Meier, Research Scientist at the National Snow and Ice Data Centre at the University of Colorado http://news.cnet.com/8301-11128_3-10213891-54.html
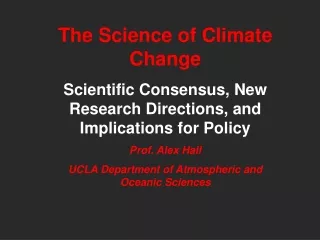
Future Estimates of CO2 Emissions From Energy: An Aggressive CO2 Emission Reduction Scenario www-static.shell.com/static/public/downloads/brochures/corporate_pkg/scenarios/shell_energy_scenarios_2050.pdf “China and India resisted signing up for a global goal of halving greenhouse gas emissions by 2050.” —Reuters July 8, 2009 China India Estimated CO2 Level in 2100 is 550ppm Current CO2 Level is 386 ppm
In Shell’s “Blueprints” Scenario, 60% of Electricity is Generated by Renewables by 2050 90% of All OECD Coal and Gas Power Plants Use Carbon Capture and Sequestration
The Earth is Warming Over 100 Times Faster TodayThan During the Last Ice Age Warming! http://scrippsco2.ucsd.edu/program_history/keeling_curve_lessons.html Monnin, et al., Science v. 291 pp. 112-114, Jan. 5, 2001. CO2 Has Risen From 335 to 385ppm (50ppm) in 30 years or 1.6 ppm per Year CO2 Rose From 185 to 265ppm (80ppm) in 6000 years or 1.33 ppm per Century
Antarctic Ice Cores Show CO2 and Temperature Have Oscillated For 800,000 Years in a Narrow Range Today 386- Vertical Range 170 to300 ppm Homo Erectus Homo Sapiens Ice Cores: Luthi, et al. Nature may 15, 2008 v. 453 pp379-82 Homonid Images: The Last Human, G.J. Sawyer and V. Deak
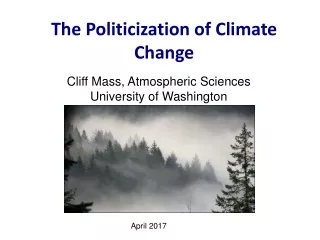
Ice Core Record Has Been Extended Using Plankton:Today’s CO2 is Higher Than in Last 2 Million Years! Possible Level by 2100, Shell “Blueprints” Scenario 550 500 450 400 Today’s CO2 Level Homo Habilis 350 CO2: Hönisch, et al. Science 19 June 2009 Vol. 324. pp. 1551 - 1554 Homonid Images: The Last Human, G.J. Sawyer and V. Deak
Earth’s Climate Hasn’t Seen the Current Level of CO2During the Entire Evolution of Homonids! With No Policy Change, MIT Estimates ~900ppm by 2100 900 ppm Australopithecus afarensis 550 ppm Sahelanthropus tchadensis Current CO2 Level Estimates of Cenozoic atmospheric pCO2 based on two independent proxies as measured in subtropical deep-sea sediment cores from the Pacific CO2: James Zachos, et al. Science v. 292 p. 686 27 Apr. 2001 Homonid Images: The Last Human, G.J. Sawyer and V. Deak
We Are Transitioning to a New Climate State --Unlike the Rapid Recovery with Acid Rain or Ozone Hole Susan Solomon, et al., PNAS 2/10/2009 v. 106 pp1704-9 Assumes CO2 Increases to a Maximum and Then Emissions Abruptly Stop Warming Persists for Over 1000 Years Warming During the Industrial Age --Last 200 Years
Earth’s Climate is Rapidly Entering a Novel RealmNot Experienced for Over 20 Million Years • “Global Warming” implies gradual, uniform, mainly about temperature, and quite possibly benign. • What’s happening is rapid, non-uniform, affecting everything about climate, and is almost entirely harmful. • A more accurate term is ‘global climatic disruption’ • This ongoing disruption is: • Real without doubt • Mainly caused by humans • Already producing significant harm • Growing more rapidly than expected” • John Holdren, Director Office of Science and Technology Policy • June 25, 2008
The IPCC Recommends a 25-40% Reduction Below 1990 Levels by 2020 • On September 27, 2006, Governor Schwarzenegger signed California the Global Warming Solutions Act of 2006 • Assembly Bill 32 (AB32) • Requires Reduction of GHG by 2020 Only to 1990 Levels • 10% Reduction from 2008 Levels; 30% from BAU 2020 Levels • 4 Tons of CO2-equiv. Reduction for Every Person in California! • The European Union Requires Reduction of GHG by 2020 to 20% Below 1990 Levels (12/12/2008) • Neither the U.S. or Canada has an Official Target Yet • President Obama Has Endorsed the AB32 2020 Goal
What Role Can ICT Play in Slowing Down the Increase in Greenhouse Gases?
ICT is a Critical Element in Achieving Countries Greenhouse Gas Emission Reduction Targets • GeSI member companies: • Bell Canada, • British Telecomm., • Plc, • Cisco Systems, • Deutsche Telekom AG, • Ericsson, • France Telecom, • Hewlett-Packard, • Intel, • Microsoft, • Nokia, • Nokia Siemens Networks, • Sun Microsystems, • T-Mobile, • Telefónica S.A., • Telenor, • Verizon, • Vodafone Plc. • Additional support: • Dell, LG. www.smart2020.org
Application of ICT Can Lead to a 5-Fold GreaterDecrease in GHGs Than its Own Carbon Footprint While the sector plans to significantly step up the energy efficiency of its products and services, ICT’s largest influence will be by enabling energy efficiencies in other sectors, an opportunity that could deliver carbon savings five times larger than the total emissions from the entire ICT sector in 2020. --Smart 2020 Report Major Opportunities for the United States* • Smart Electrical Grids • Smart Transportation Systems • Smart Buildings • Virtual Meetings * Smart 2020 United States Report Addendum www.smart2020.org
Developing Greener Smart Campuses as Societal Prototypes: Calit2 (UCSD & UCI) Student Video -- UCSD Living Laboratory for Real-World Solutions www.gogreentube.com/watch.php?v=NDc4OTQ1 on UCSD UCI Named ‘Best Overall' in Flex Your Power Awards www.today.uci.edu/news/release_detail.asp?key=1859 • Coupling the Internet and the Electrical Grid • Choosing non-GHG Emitting Electricity Sources • Measuring Demand at Sub-Building Levels • Reducing Local Energy Usage via User Access Thru Web • Transportation System • Campus Wireless GPS Low Carbon Fleet • Green Software Automobile Innovations • Driver Level Cell Phone Traffic Awareness • Travel Substitution • Commercial Teleconferencing • Next Generation Global Telepresence
I Link Into Commercial H.323 Videoconfernces From My Laptop at Home UCSD Calit2 Director & Chief of Staff UCI Calit2 Director The Weekly Calit2 Director’s Meeting
Work at Home is the Same As at the Office Virtual Kristen Kristen Prints Here For Amy Real Amy Kristen Reads My Email, Sets My Calendar. Works With Amy on My Trips We Run Video Sykpe Continuously During Office Hours
Linking the Calit2 Auditoriums at UCSD and UCI with HD for Shared Seminars September 8, 2009 Photo by Erik Jepsen, UC San Diego
Launch of the 100 Megapixel OzIPortal Kicked Off a Rapid Build Out of Australian OptIPortals January 15, 2008 January 15, 2008 No Calit2 Person Physically Flew to Australia to Bring This Up! Covise, Phil Weber, Jurgen Schulze, Calit2 CGLX, Kai-Uwe Doerr , Calit2 http://www.calit2.net/newsroom/release.php?id=1421
HD Talk to Australia’s Monash University from Calit2:Reducing International Travel July 31, 2008 Qvidium Compressed HD ~140 mbps Source: David Abramson, Monash Univ
OptIPlanet Collaboratory Persistent Infrastructure Between Calit2 and U Washington Photo Credit: Alan Decker Feb. 29, 2008 Ginger Armbrust’s Diatoms: Micrographs, Chromosomes, Genetic Assembly iHDTV: 1500 Mbits/sec Calit2 to UW Research Channel Over 10,000 Mbps Pacific Wave/CENIC Dedicated Optical Fiber
Telepresence Meeting Using Digital Cinema 4k Streams Keio University President Anzai UCSD Chancellor Fox 4k = 4000x2000 Pixels = 4xHD Streaming 4k with JPEG 2000 Compression ½ Gbit/sec 100 Times the Resolution of YouTube! Lays Technical Basis for Global Digital Cinema Sony NTT SGI Calit2@UCSD Auditorium
Toward a Data and Visualization IntensiveWorking Environment Across Remote Sites Calit2@ UCI wall NASA Ames Visit Feb. 29, 2008 HiPerVerse: First ½ Gigapixel Distributed OptIPortal-124 TilesSept. 15, 2008 Calit2@ UCSD wall UCSD cluster: 15 x Quad core Dell XPS with Dual nVIDIA 5600s UCI cluster: 25 x Dual Core Apple G5
Building a Mixed Virtual/Physical Working Space:NASA Ames Adopts OptIPuter Collaboratory Feb 19, 2009 From Start to This Image in Less Than 2 Weeks! View from NASA Ames Lunar Science Institute Mountain View, CA Virtual Handshake LifeSize High Defn. Video Integrated With OptIPortal and Spatialized Audio NASA Interest in Supporting Virtual Institutes NASA Astrobiology Institute Is Next Source: Falko Kuester, Calit2; Michael Sims, NASA
Real-Time Monitoring of Building Energy Usage:UCSD Has 34 Buildings On-Line http://mscada01.ucsd.edu/ion/
Comparision Between UCSD Buildings:kW/sqFt Year Since 1/1/09 Calit2 and CSE are Very Energy Intensive Buildings
Power Management in Mixed Use Buildings:The UCSD CSE Building is Energy Instrumented Source: Rajesh Gupta, CSE, Calit2 • 500 Occupants, 750 Computers • Detailed Instrumentation to Measure Macro and Micro-Scale Power Use • 39 Sensor Pods, 156 Radios, 70 Circuits • Subsystems: Air Conditioning & Lighting • Conclusions: • Peak Load is Twice Base Load • 70% of Base Load is PCs and Servers • 90% of That Could Be Avoided!
Reducing Traffic Congestion: Calit2 California Peer-to -Peer Wireless Traffic Report • Citizen to Citizen Accident Reports • Real-Time Freeway Speeds • “Leave Now” Paging Services 20,000+ Users > 1000 Calls Per Day San Diego(866) 500 0977 LA & OC (888) 9 CALIT2 Bay Area (888) 4 CALIT2 http://traffic.calit2.net Source: Ganz Chockalingam, Calit2
Launch of ZEVnet Fleet of Wireless Cars-- First Calit2 Testbed for Intelligent Transportation April 18, 2002 Irvine, CA www.zevnet.org
International Symposia on Green ICT:Greening ICT and Applying ICT to Green Infrastructures Webcasts Available at: www.calit2.net/newsroom/article.php?id=1456 Calit2@UCSD
What Do We Need to Do to Clean Up ICT’sGreenhouse Gas Emissions?
The Global ICT Carbon Footprint isRoughly the Same as the Aviation Industry Today But ICT Emissions are Growing at 6% Annually! Most of Growth is in Developing Countries • the assumptions behind the growth in emissions expected in 2020: • takes into account likely efficient technology developments that affect the power consumption of products and services • and their expected penetration in the market in 2020 www.smart2020.org
Reduction of ICT Emissions is a Global Challenge –U.S. and Canada are Small Sources U.S. and Canada Together Fall From 25% to 14% of Global ICT Emissions by 2020 www.smart2020.org
The Global ICT Carbon Footprint by Subsector The Number of PCs (Desktops and Laptops) Globally is Expected to Increase from 592 Million in 2002 to More Than Four Billion in 2020 PCs Are Biggest Problem Data Centers Are Rapidly Improving www.smart2020.org
Can We Reduce the Energy Used By PCs ViaPutting Machines To Sleep Transparently? Rajesh Gupta, UCSD CSE; Calit2 Laptop Network interface Peripheral Low power domain Secondary processor Network interface Management software Main processor, RAM, etc Somniloquy Enables Servers to Enter and Exit Sleep While Maintaining Their Network and Application Level Presence
Research Needed on How to Deploy a Green CI MRI • Computer Architecture • Rajesh Gupta/CSE • Software Architecture • Amin Vahdat, Ingolf Kruger/CSE • CineGrid Exchange • Tom DeFanti/Calit2 • Visualization • Falko Kuster/Structural Engineering • Power and Thermal Management • Tajana Rosing/CSE • Analyzing Power Consumption Data • Jim Hollan/Cog Sci • Direct DC Datacenters • Tom Defanti, Greg Hidley http://greenlight.calit2.net
New Techniques for Dynamic Power and Thermal Management to Reduce Energy Requirements • NSF Project Greenlight • Green Cyberinfrastructure in Energy-Efficient Modular Facilities • Closed-Loop Power &Thermal Management • Dynamic Power Management (DPM) • Optimal DPM for a Class of Workloads • Machine Learning to Adapt • Select Among Specialized Policies • Use Sensors and Performance Counters to Monitor • Multitasking/Within Task Adaptation of Voltage and Frequency • Measured Energy Savings of Up to 70% per Device • Dynamic Thermal Management (DTM) • Workload Scheduling: • Machine learning for Dynamic Adaptation to get Best Temporal and Spatial Profiles with Closed-Loop Sensing • Proactive Thermal Management • Reduces Thermal Hot Spots by Average 60% with No Performance Overhead System Energy Efficiency Lab (seelab.ucsd.edu) Prof. Tajana Šimunić Rosing, CSE, UCSD
UCSD is Installing Zero Carbon EmissionSolar and Fuel Cell DC Electricity Generators UCSD 2.8 Megawatt Fuel Cell Power Plant Uses Methane Available Late 2009 San Diego’s Point Loma Wastewater Treatment Plant Produces Waste Methane Use to Power Local Data Centers 2 Megawatts of Solar Power Cells Being Installed
Zero Carbon GreenLight Experiment:DC-Powered Modular Data Center Sun Box <200kWatt • Concept—Avoid DC to AC to DC Conversion Losses • Computers Use DC Power Internally • Solar and Fuel Cells Produce DC • Both Plug into the AC Power Grid • Can We Use DC Directly (With or Without the AC Grid)? • DC Generation Can Be Intermittent • Depends on Source • Solar, Wind, Fuel Cell, Hydro • Can Use Sensors to Shut Down or Sleep Computers • Can Use Virtualization to Halt/Shift Jobs • Experiment Planning Just Starting • Collaboration with Sun and LBNL • NSF GreenLight Year 2 and Year 3 Funds Source: Tom DeFanti, Calit2; GreenLight PI
“It Will Be the Biggest Single Peacetime Project Humankind Will Have Ever Undertaken”