Download
1 / 45
460 likes | 616 Views
The Science of Climate Change. Dr. Douglas Allen Dept. of Physics and Astronomy Dordt College, Sioux Center, Iowa April 19, 2007. Why is the Debate so Confusing? Scientific Reasons Philosophical Reasons Climate Change Science Indicators Attribution Projections

E N D
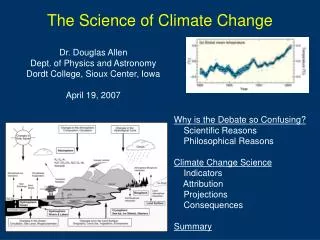
The Science of Climate Change Dr. Douglas Allen Dept. of Physics and Astronomy Dordt College, Sioux Center, Iowa April 19, 2007 Why is the Debate so Confusing? Scientific Reasons Philosophical Reasons Climate Change Science Indicators Attribution Projections Consequences Summary
Climate vs. Weather Climate and weather are both described in terms of physical properties of the atmosphere (temperature, wind, pressure, humidity, precipitation, etc.) Weather: refers to what is happening at any given time (example: today’s high temperature is …) Climate: refers to average weather over time and/or geographic area. (example: the average temperature in Iowa in 2005 was …) “Climate change”: refers to a change in the average weather over a certain geographic area. “Global climate change”: refers to the change in the average climate over the whole Earth.
Why is the Climate Change Debate so Confusing? Scientific Reasons • Climate changes occur on long time-scales need long data records to discern trends • Climate change trends are smaller than normal weather fluctuations need good statistics • The atmosphere-ocean system is very complicated need computer models • Projections depend on uncertain human actions need to develop plausible scenarios • No one can be an expert on all areas of the debate need to decide who you will trust
Why is the Climate Change Debate so Confusing?Philosophical Reasons • Worldviews influence how we filter scientific “data”. “Virtually all the major disagreements between rival theories in the sciences and in philosophy can be ultimately traced to the differences between the religious beliefs that guide them.” (R. Clouser, The Myth of Religious Neutrality). • (Unwritten) rules of policy argument tend to be more lenient than rules of scientific argument. In policy argument, scientific “facts” may be poorly presented in order to support a particular position. • Policy debate demands fast answers and can be unsympathetic to scientific caution. For further discussion see “The Science and Politics of Global Climate Change: A Guide to the Debate,” by A. Dessler and E. Parson, 2006.
The Responsibility of the Scientist in the Climate Change Debate • Provide accurate information about the likely magnitude, causes, and projections of global climate change. • Be up front about all assumptions made. • Provide levels of uncertainty and statistical significance. • Use the peer-review process (an effective filter). • Provide results that are reproducible and refutable. • Provide quantitative results, not anecdotal evidence. • Reference claims to peer-reviewed publications.
Climate Change Research • Information sources • Observations of Climate Variables • Direct: weather stations, ships, planes, buoys, satellites • Indirect: tree rings, ice cores, corals, ocean sediments, boreholes, glacier records, etc. • Models that Simulate Past and Future Climate • Global circulation models (GCMs) • Regional climate models (RCMs) • Coupled Atmosphere Ocean GCMs (AOGCMs) • Dissemination of information • Peer-reviewed journal articles • Scientific Assessments • Intergovernmental Panel on Climate Change (IPCC) • Reports published in 1990, 1995, 2001, 2007
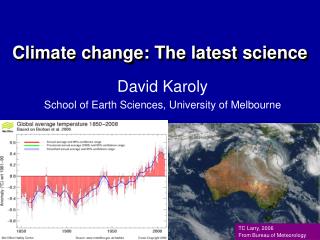
Is the Global Surface Temperature Rising? Warming is larger over landWarming is larger during winterWarming is larger at high latitudes Increase of 0.74oC or 1.3oF from 1906-2005 Global Average Temperature Deviation (1850-2005)IPCC 2007 Figure SPM-3 Data from thermometers N. Hemisphere Temperature (1000-2000) The “Hockey Stick” Diagram Data from tree rings, ice cores, and other proxies See Mann et al., Geophys. Res. Lett., 26 (6), 759-762, 1999.
Other Indicators of 20th Century Warming • 17 centimeter (±5) sea level rise • Decline in NH snow cover • Retreat of mountain glaciers • Global ocean heat content increase since the late 1950’s (when we started collecting good data) • 10 -15% drop in Arctic spring and summer sea-ice extent • Warming of lower- and middle troposphere • Average atmospheric water vapor content increase From Climate Change 2007: The Physical Science Basis, IPCC. See IPCC Climate Change 2001: Working Group I Technical Summary
Potential Causes of 20th Century Warming • Earth’s orbital variations Large timescales • Tectonic activity Large timescales • Volcanoes Irregular, short-lived impact • Internal variability Magnitude of internal variability too small to account for observed global-scale changes • Solar variability Solar variations play a role in climate, but sun’s output has been relatively steady over last 25 years • Human activities Enhanced greenhouse effect Enhanced aerosols See “The Science and Politics of Global Climate Change: A Guide to the Debate,” by A. Dessler and E. Parson, 2006.
Total Solar Irradiance (1600-2000) ~0.25% increase (~3 W/m2) Maunder Minimum Data from Lean (2000) Data from Solanki and Krivova (2003) Little Ice Age
Solar Variations 0.06 W/m2 decrease (1980-2005) • The Sun has a 0.54 W/m2 increase (1980-2005) 0.62 W/m2 increase (1980-2005) 0.10 W/m2 increase (1980-2005)
Potential Causes of 20th Century Warming • Earth’s orbital variations Large timescales • Tectonic activity Large timescales • Volcanoes Irregular, short-lived impact • Internal variability Magnitude of internal variability too small to account for observed global-scale changes • Solar variability Solar variations play a role in climate, but sun’s output has been relatively steady over last 25 years • Human activities Enhanced greenhouse effect Enhanced aerosols See “The Science and Politics of Global Climate Change: A Guide to the Debate,” by A. Dessler and E. Parson, 2006.
The Greenhouse Effect Visible/UV Infrared Visible/UV Visible/UV Infrared Average temperature without greenhouse gasses = -6°C (21°F) Average temperature with greenhouse gasses = +15°C (59°F)
Characteristics of Greenhouse Gases Note: Water vapor is the dominant greenhouse gas, but water vapor respond quickly to the atmospheric temperature and so is treated as a part of the climate system that responds to external forcing.
379 parts per million in 2005 Trends of Greenhouse Gas Concentrations CO2 has risen by 35 % N2O has risen by 18 % 280 parts per million CH4 has risen by 148 %
Correlation vs. Attribution Carbon dioxide increase appears to correlate well with recent increase in temperature. But a correlation alone doesn’t necessarily indicate cause and effect. [Examples] In order to attribute causal relationship scientists construct models to test the relative effects of various physical processes.
Attribution of Climate Change Using Models • To establish cause-effect relationship, need to use computer models that simulate the known “laws” of physics, chemistry, etc. • Climate models are similar to weather models, but focus on large-scale, long-term changes rather than short forecasts. • Models attempt to reconstruct past climate as well as project future climate.
The global mean radiative forcing of the climate system for 2005 relative to 1750 IPCC 4th Assessment Report Figure SPM-2
Earth Sun Solar EnergyIR Energy Absorbed by Earth = Emitted by EarthEarth (1 – A) E = σ T4 E = 343 W/m2 (Average Solar Flux at Earth) A = 0.16 (Earth’s Albedo, without clouds) T = 267° K = -6° C (Earth’s average temperature) Simple Climate Model Results See “Global Warming: The Complete Briefing” by John Houghton Temperature without GG = -6°C (21°F) Temperature with GG = +15°C (59°F) Doubling carbon dioxide (all else constant) should result in an increase of 1.2°C. With feedbacks (water vapor, ice-albedo, clouds), expected increase of 2 to 4.5°C
GCM reconstructions of global average temperature (1860-2000) Including Solar + Volcanic Activity Including Greenhouse Gas increases GG Model Solar Including All Factors Observations Sulfate Aerosols See Stott et al., Science, 290, 15 Dec. 2000, 2133-2137, 2000.
Model Projections of Global Average Temperature Projection based on IPCC B2 Scenario See Stott et al., Science, 290, 15 Dec. 2000, 2133-2137, 2000.
Global Average Temperature Global Average Precipitation Multiple Model Projections Models generally predict increased precipitation Average temperature increase of 1.8 C over 70 years. Experiments with 1% per year increase in carbon dioxide. Doubling of carbon dioxide would occur in year 70. All 20 models show increased warming, and most models show increased precipitation. From Climate Change 2001: The Scientific Basis, IPCC.
Projected temperature and sea levels based on various carbon emission scenarios Global Average Temperature Global Average Sea Level Increase from 1.7 to 4.2°C (3 to 7.5°F) Increase from 10 to 90 cm From Climate Change 2001: The Scientific Basis, IPCC. Projections from 4th Assessment Report (graphs not yet available): Temperature increase of 1.1 – 6.4°C, Sea Level Rise of 18-59 cm
Likely Global Warming Consequences • Increasing GG Concentrations? Virtually certain • Rising Temperatures? Virtually certain • Melting ice? Virtually certain • Rising Sea Levels? Very likely • Eroding coastlines? Very likely J. Knox, Living in a Globally Warmed World, Phi Kappa Phi Forum, Vol. 86, 11-16.
Possible Global Warming Consequences • Strengthening Hurricanes? The jury is out • Intensifying heat waves? Possible • Worsening droughts and floods? Possible • Invading tropical diseases? Possible • Proliferating tornadoes? Unlikely J. Knox, Living in a Globally Warmed World, Phi Kappa Phi Forum, Vol. 86, 11-16.
Summary • Climate is influenced by many complex factors, some of which we understand well while others are poorly understood. • Observational evidence supports global average surface warming of ~0.74°C, sea level rise of ~17 cm over the last century, and widespread melting of snow and ice. • Most of the observed increase in globally averaged temperatures since the mid-20th century is very likely due to the observed increase in anthropogenic greenhouse gas concentrations. • Models project additional warming of 1.1 – 6.4°C and sea level rise of 18 - 59 cm by end of the 21st century. • Regional impacts are also likely, but specific projections are more uncertain than large-scale projections.
Short List of Recommended Resources • IPCC Assessment Reports • www.ipcc.ch • Web pages • www.realclimate.org • Books • Global Warming: The Complete Briefing • John Houghton • The Science and Politics of Global Climate Change • Andrew Dessler and Edward Parson • Surface Temperature Reconstructions for the Last 2000 Years • National Research Council, 2006 • Data • World Data Center for Paleoclimatology • www.ncdc.noaa.gov/paleo/data.html
Winter Temperature Trends (1976-2000) Summer Temperature Trends (1976-2000) IPCC TAR Fig 2.10 Jones et al. (2001)
Around 10 million people in Bangladesh live less than 1 meter above sea level.
Milankovich Cycles Quinn, T.R. et al. "A Three Million Year Integration of the Earth's Orbit." The Astronomical Journal 101 pp. 2287-2305 (June 1991).
The global mean radiative forcing of the climate system for 2005 relative to 1750 IPCC WGI Fourth Assessment Report Figure SPM-2
Geographic Distribution of Trends (1976 – 2000) IPCC TAR Figure 2.9. Adapted from Jones, P.D., T.J. Osborn, K.R. Briffa, C.K. Folland, E.B. Horton, L.V. Alexander, D.E. Parker and N.A. Rayner, 2001: Adjusting for sampling density in grid box land and ocean surface temperature time series. J. Geophys. Res., 106, 3371-3380.
Atmospheric “Governing Equations” Conservation of momentum Climate models attempt to solve this system of equations numerically (i.e., with computers). Models attempt to reconstruct past climate and predict the future climate. Conservation of mass Equation of state Conservation of energy Conservation of moisture
Earth’s Atmosphere Composition: 78% nitrogen 21% oxygen other “trace” gases (water vapor, carbon dioxide, ozone, methane, etc.) Density at surface: 1.275 kg/m3 Pressure at surface: 1 atm (14.7 lb/in2) Troposphere (0-10 km) Stratosphere (10-50 km) Mesosphere (50-80 km) Thermosphere (above 80 km) Average Surface Temp (15°C, 59°F)
Earth’s Orbital Variations (Milankovitch Cycles) Precession (23,000 year cycle) Current Distance of Earth from Sun January: Earth at 147 million km July: Earth at 152 million km Total Solar Irradiance at Top of Earth’s Atmosphere 7% diff in TSI between Jan/July Data from SORCE/TIM Mission: http://lasp.colorado.edu/sorce Jan July
Eccentricity (100,000 year cycle) Earth’s Orbital Variations (Milankovitch Cycles) Obliquity (41,000 year cycle) http://www.homepage.montana.edu/~geol445/hyperglac/time1/milankov.htm