Download
1 / 7
80 likes | 243 Views
EVALUATING MERCURY EXPOSURE AND SOURCE ATTRIBUTION USING GEOS-CHEM. Noelle Eckley Selin Joint Program on the Science and Policy of Global Change Center for Global Change Science Massachusetts Institute of Technology GEOS-Chem Users’ Meeting 8 April 2009.

E N D
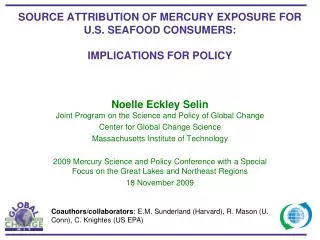
EVALUATING MERCURY EXPOSURE AND SOURCE ATTRIBUTION USING GEOS-CHEM Noelle Eckley SelinJoint Program on the Science and Policy of Global Change Center for Global Change Science Massachusetts Institute of Technology GEOS-Chem Users’ Meeting 8 April 2009 Coauthors/collaborators:E.M. Sunderland (Harvard), R. Mason (U. Conn), C. Knightes (US EPA)
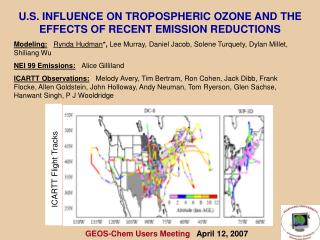
NORTH AMERICAN VS. INTERNATIONAL DEPOSITION Results from GEOS-Chem global land-ocean-atmosphere Hg model [Selin et al., 2007, 2008] Up to 60% of deposition in Midwest/Northeast is from domestic sources Florida has highest deposition in the U.S., but mostly from non-US sources Policy implications: Reducing deposition in both Midwest and Southeast will require policy actions on multiple political scales (national and global) [Selin & Jacob, AE 2008]
FROM DEPOSITION TO FISH METHYLMERCURY [Engstrom et al., 2007]
9% 32% 23% 59% 11% 66% FRESHWATER DEPOSITION AND SOURCE ATTRIBUTION How do sources affect fish methylmercury, and on what timescales? Northeast U.S. Southeast U.S. International Anthropogenic 24.21 g m-2 y-1 34.08 g m-2 y-1 Pre-industrial + Historical N. American Anthropogenic SERAFM: Lake model WASP7: River model WCS (MLM): Watershed loading BASS: Aquatic food web [Knightes et al., 2009] Policy and Timescale Analysis [Selin et al., EHP, submitted]
FRESHWATER TIMESCALE ANALYSIS Each ecosystem driven by present-day deposition for 40 years Policy experiment: All Hg is “historical” at t=0. How is anthropogenic signal reflected in fish, and on what timescale? Ecosystem A Same deposition,but different ecosystem dynamics lead to very different source attributions (and concentrations) over time Fish MeHg (ppm) Ecosystem B Note difference in scale! Regional differences in deposition sources lead to different attributions in similar ecosystems [Selin et al., EHP, submitted]
LOCAL EXPOSURE FROM FRESHWATER FISH 2 x 100 g fish meals/week (60 kg person) @ t=40 y 6.4 North American anthropogenic International anthropogenic Historical+Natural WHO intake threshold EPA Reference Dose Ecosystem A Ecosystem A Ecosystem B Ecosystem B Southeast Northeast [Selin et al.,EHP, submitted]
POPULATION-WIDE EXPOSURE FROM MARINE FISH No mechanistic link (yet) from oceanic Hg concentration to fish methylmercury Historical exposure could continue to increase, complicating policy decision-making Different challenges on different scales (local to global) Application of economic analysis? “current emissions” scenario 14-box ocean model: Sunderland and Mason, 2007 [Selin et al., EHP, submitted]