Download
1 / 18
190 likes | 390 Views
GEOS-CHEM at the University of Washington. Lyatt Jaeglé, Qing Liang, Linda Steinberger, Sarah Strode, Ricky Sinha Long-range transport of CO and O 3 to the NE Pacific Biomass burning in Africa: GOME and SAFARI 2000 Global modeling of the mercury cycle

E N D
GEOS-CHEM at the University of Washington Lyatt Jaeglé, Qing Liang, Linda Steinberger, Sarah Strode, Ricky Sinha Long-range transport of CO and O3 to the NE Pacific Biomass burning in Africa: GOME and SAFARI 2000 Global modeling of the mercury cycle Interactive display of GEOS-CHEM results on the web
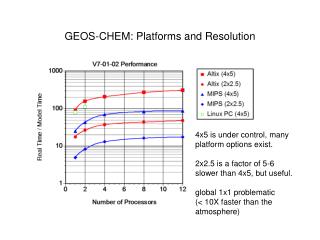
Long-range transport of CO and O3 to the NE Pacific Qing Liang Collaborators: Dan Jaffe and his group at UW Bothell • Model evaluation with PHOBEA observations in NE Pacific: • Spring 1997, 1998, 2001, 2002: CO, O3 [NMHC, NOx, PAN, Rn] • Full seasonal cycle Mar 2001-June 2002: CO, O3 • Applications: • Origin of CO and O3 in NE Pacific: long-range transport from Asia • Seasonal and interannual variability in long-range transport GEOS-CHEMforecasts:ITCT2K2 and PHOBEA-II during spring 2002 Cheeka Peak Observatory Duchess aircraft
North America Asia Stratosphere Asia Europe Origin of CO and O3 at Cheeka Peak: Spring 2002 CO O3 Model Observations Model underestimates O3 levels by 7 ppbv and poor correlation Very good agreement: Model captures background levels and day-to-day variability in CO Obs: 149 ppbv; Model: 153 ppbv; r2= 0.68 Obs: 43 ppbv; Model: 36 ppbv; r2= 0.27
Vertical profiles above CPO during spring 200112 Duchess aircraft flights CO profiles O3 profiles Model Observations • Very good agreement for CO • BUT for ozone negative bias near surface and positive bias aloft: Strat-trop exchange? N2O5 hydrolysis (Temp. dependent)? NOx emissions?
Seasonal variations of CO in 2001 at CPO spring 2002 North America Asia spring 2001 spring 2002 summer fall winter
Biomass burning in Africa: SAFARI 2000 Ricky Sinha, Peter Hobbs • Model evaluation with SAFARI 2000 observations Aug-Sep 2000: • UW Convair 580: CO, O3, SO2, NMHCs • Ozonesondes [Thompson et al., 2000] • Improve biomass burning, fossil fuel, and biogenic emission inventories • Applications: • Origin of haze over Africa • Export of biomass burning and anthropogenic emissions through the river of smoke (Indian Ocean) vs. to the Atlantic Timbavati fire UW CONVAIR 580 P. Hobbs
Biomass burning over Botswana and Zambia Clean marine air over Namibia + Mozambique coasts O3 GEOS-CHEM Longitude Obs: 60 ppbv; Model: 44 ppbv; r = 0.72 UW Convair 580 flight tracks and O3 O3 UW Convair 580 Longitude
SHADOZ ozonesondes during SAFARI2k Lusaka, Zambia Model Longitude Irene, South Africa Observations Model Observations SAFARI 2K ozonesondes: Thompson et al. [2002]
SAFARI’s river of smoke September 5 2000 TOMS Aerosol Index GEOS-CHEM CO Eck et al., 2003
Using satellite observations to constrain biomass burning emissions in Africa: GOME Linda Steinberger Collaborators: Randall Martin, Kelly Chance, Paul Palmer Aug-Sep 2000 GOME NO2, HCHO columns GEOS-CHEM Other satellites: Fires/burned areas (SPOT, ATSR) Aerosol optical depth (MODIS) MOPITT CO Plume studies
0.40 Tg N 0.41 Tg N Spatial distribution of fires [Duncan et al., 2002] Burned Area (SPOT-VGT) ATSR Fire counts Global Burned Area 2000 Project [Silva et al., 2003] NO2 columns in Aug. 2000: GOME & GEOS-CHEM GOME NO2 GEOS-CHEM NO2 1015 cm-2
NO2 & HCHO columns in August 2000 GOME NO2 GEOS-CHEM NO2 1015 cm-2 GOME HCHO GEOS-CHEM HCHO 1016 cm-2 Isoprene emissions in GEOS-CHEM too large? Biomass burning VOC in GEOS-CHEM too small?
West to East progression in biomass burning during the dry season GOME NO2 Burned area GOME HCHO Jul ‘00 Aug ‘00 Sep ‘00 1016 cm-2 1015 cm-2
NOx emissions over Africa: July-February Southern Africa (0-20ºS) Northern Africa (0-30ºN) GOME GEOS-CHEM Jul Aug Sep Oct Nov Dec Jan Feb Jul Aug Sep Oct Nov Dec Jan Feb
GEOS-CHEM Mercury simulation Sarah Strode, Igor Kamenkovich (JISAO) Collaborators: Noelle Eckley, Rokjin Park, Daniel Jacob • Model development: • Ocean mercury module • Biomass burning emissions • Model evaluation: • Surface observations networks (Canada, US, Europe) • Remote sites (Cheeka Peak Observatory) + cruises + vertical profiles • Applications: • Role ocean in the mercury cycle • Long-range transport of mercury from Asia • Evolution of mercury since pre-industrial times
Development of a GEOS-CHEM ocean mercury module • Implement air-sea exchange of mercury using temperature and wind-dependent transfer velocities • Couple GEOS-CHEM with a mixed-layer ocean model: wind-driven advection of Hg0/Hg2+ • Implement oxidation of Hg2+ to Hg0 in surface waters (photoch./biol.) • Investigate rapid oxidation of Hg0 in marine boundary layer For longer timescale simulations, use a 3-D ocean GCM (MOM 2) Wet & dry deposition Free troposphere Net evasion ? Marine boundary layer Hg2+ Hgo Upper ocean Hgp Hg2+ Hgo ? Particle removal http://jchemed.chem.wisc.edu/
An interactive web interface to display GEOS-CHEM results:http://www.atmos.washington.edu/~jaegle/geoso3_start.html • Web interface using ION (IDL On the Net) to access GAMAP and plot GEOS-CHEM fields • Interactive creation of maps, zonal means, and animations • Monthly mean fields from Ox-NOx-NMHC simulations: 4°x5° (1994-1997) and 2°x2.5° (1997)
ITCT2K2 Automatic Processing System (IAPS) interactive web interface • GEOS-CHEM 5-day CO forecasts transferred from Harvard to UW • Interactive creation of maps, vertical profiles, timeseries, and animations from the forecast output • Successful use in the field for flight planning