Download
1 / 27
270 likes | 395 Views
Study of H- ion extraction and beam optics using the 2D3V and 3D3V PIC methods. Explore negative ion source development for plasma heating in magnetic fusion reactors and beam halo formation. Integrated modeling from plasma meniscus to beam acceleration.

E N D
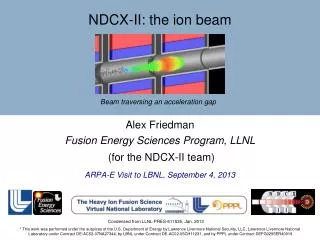
Negative Ion Modeling Workshop, 16-18, September 2013, Keio University, Japan Study of H- ion extraction and beam optics using the 2D3V and 3D3V PIC method K. Miyamoto1), S. Nishioka2),S. Okuda3), I. Goto2), A. Hatayama2) 1) Naruto University of Education 2) Faculty of Science and Technology, Keio University 3) Toshiba corporation
Contents • Introduction • 2. 2D3V PIC model (K. Miyamoto) • 1) Negative ion beam optics with integrated model (source plasma, extraction region, and accelerator) • ・Comparison of negative ion trajectories for beam core and beam halo • ・Emittance diagrams • 2) The dependence of the plasma meniscus formation and beam halo on the physical parameters • 3. 3D3V PIC model (S. Nishioka) • ・Comparison of the plasma meniscus and beam halo fractions between 2D and 3D models.
Introduction (I) ・A negative ion source which can produce negative ion beams with high power and long pulse is the key component for the negative ion based NBI system for plasma heating and current drive of magnetic fusion reactors. ・It is essential for the development of such a negative ion source to suppress heat loads of the acceleration grids and beamline components. ・The heat loads of acceleration grids are mainly caused by the direct interception of H- ion beam as well as electrons stripped from negative ions in the accelerator. ・Especially, a beam halo can result in the heat loads even at the optimum perveance for the beam core.
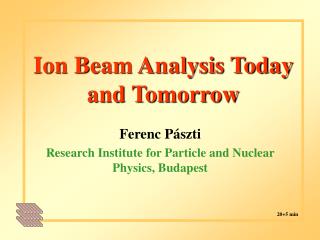
The beam halo is observed directly as the beam profile, or indirectly as a component of the heat loads in the accelerator grids. Beam halo component in the negative ion beam profile H.P.L. de Esch, L. Svensson, Fusion Engineering and Design 86, 363 (2011) Beam halo can be clearly observed on the log scale. Heat load on the acceleration grids due to the interception of negative ion beam M.Kamada, M.Hanada, Y.Ikeda and L.R. Grisham, AIP Conf. Proc. 1097, 412 (2009). A1G A2G GRG SL D- ]
Introduction (II) ・The purpose of our study is to clarify the physical mechanism of beam halo formation, especially the relation between the meniscus and beam halo, in order to suppress the heat load due to the direct interception of negative ion beams. ・We have succeeded in the integrated modeling of negative ion beam from plasma meniscus formation to the beam accelerationby extending our previous 2D3V PIC model . ・Our extended model makes it possible to simulate not only the source plasma with surface H- production, but also the H- accelerationself-consistently without any assumption of plasma meniscus. ・The dependence of the plasma meniscus formation and beam halo on the following physical parameters are investigated: - Negative ion current density - Extraction voltage - Effective electron confinement time
2D PIC simulation model (I) electron e + H+ Magnetic filter All the particles - H- + + - e e e × - B-field for electron suppression - source plasma removed Dirichlet condition A2G GRG PG A1G ESG EXG Dirichlet condition Dirichlet condition electron or H+ electron or H+ e e e e e e e e A2G A2G GRG GRG PG PG EXG EXG A1G A1G ESG ESG
2D PIC simulation model (III) 1. Main physical parameters in the source region Physical parameters Symbol Value Electron temperature 1 eV Hydrogen ion temperature 0.25 eV 0.25 eV (volume production) 1.4 eV (surface production) Electron density 1018m-3 Electron Debye length 7.4×10⁻⁶ m Electron plasma frequency 5.6×10¹⁰ rad/s ・Initial number of super-particles electron: Ne = 9.5×10⁵, H+: NH+ = 1×10⁶, volume produced H-: NH- = 5×10⁴ The ratio of NH- to Ne is determined from the experimental result of nH- / ne in the volume production. C. Courteille, A. M. Bruneteau, M. Bacal, Rev. Sci. Instrum., vol. 66, 2533-2540 (1995). ・Electrons, H+ ions, and volume produced H- ions are assumed to be launched with Maxwellian distributions.
2D PIC simulation model (III) EXG PG H- H- H- y ~ H- H- H- ~ x e e 2. Electron Diffusion process across the transverse magnetic field due to electron-electron and electron-neutral collisions Magnetic filter A random-walk process with step lengths normalized random number A characteristic time of electron escape to the arc chamber A characteristic time of electron diffusion across the magnetic filter 3. Surface produced negative ions on the surface of the PG ・Surface produced negative ions are uniformly launched from the PG surface with a half-Maxwellian distribution (TH- = 1.4 eV). R. McAdams, A. J. T. Holmes, D. B. King, and E. Surrey, Plasma Sources Sci. Technol. 20, 035023-1 (2011).
Simulation results of negative ion beam trajectory (I) JH- ~ x y ~ ~ ・The present PIC code can reproduce the beam halo observed in an actual negative ion beam. Negative ion beam profile near the exit of the GRG Snapshot of electrons and negative ions H- ion electron EXG PG A2G ESG A1G GRG 90 80 70 60 50 40 30 20 10 0 0 200 400 600 800 1000 1200 1400 1600
Simulation results of negative ion beam trajectory (II) ・Negative ion current density 3 mA / cm2 (only volume production) 17.8 mA / cm2 (volume production + surface production) ・Fraction of heat loads in the accelerator grids due to the intercepted negative ion beam are evaluated: A1G: 0 %, A2G: 0.44 %, GRG: 3.2 % The heat load due to the intercepted negative ions becomes larger in the downstream grid. This tendency agrees well with the experimental result.
Particle density profile around the PG 90 80 70 60 50 40 30 20 10 0 90 80 70 60 50 40 30 20 10 0 50 60 70 80 90 100 110 120 130 50 60 70 80 90 100 110 120 130 y y y x x x ~ ~ ~ ~ ~ ~ H+ ion electron ・The surface produced H- ion density is high not only at the location of H- ion extraction aperture, but also in the bulk plasma away from the PG. ・The electron density in the bulk plasma near the PG is negligible. ・Therefore, the plasma quasi-neutrality is held by H+ and H- ion, i.e., double ion plasma. The present calculation result supports the experimental result. K. Tsumori et al.,, Rev. Sci. Instrum., 83 02B116-1 (2012). H- ion 90 80 70 60 50 40 30 20 10 0 50 60 70 80 90 100 110 120 130
Potential Profile around the PG (I) φ φ ~ ~ y x ~ ~ 90 80 70 60 50 40 30 20 10 0 50 60 70 80 90 100 110 120 130 Potential distributions ・The potential well, which is formed in order to accelerate H+ ions and reflect the surface produced H- ions toward the PG. - A. Hatayama, Rev. Sci. Instrum.79, 02B901/1-7 (2008); - F. Taccogna, P. Mineli, S. Longo, M. Captitelli, and R. Schneider, Phys. Plasma, 17, 063502-1 (2010). ・The depth of the potential well is evaluated to be approximately 0.5 eV. Line (a) Line (b) Line(b) Line(a)
Potential Profile around the PG (II) x x y y ~ ~ ~ ~ The potential profile with the surface produced negative ions is different from that without these negative ions: Without surface produced negative ions The electric field for the negative ion extraction is penetrated into the source plasma region along the PG surface. With surface produced negative ions Due to the space charge of these negative ions, the penetration of the electric field for the negative ion extraction is suppressed. PG PG Side wall base edge
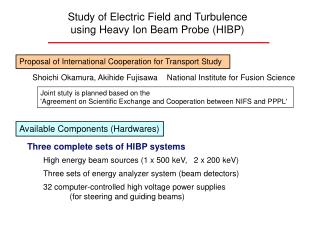
Beam core trajectories x y x y ~ ~ ~ ~ The surface produced negative ions move into the source plasma region, andare extracted from the central region of the meniscus. These negative ions are focused by the electrostatic lens formed around the ESG. EXG PG A2G ESG A1G GRG PG 90 80 70 60 50 40 30 20 10 0 EXG 0 200 400 600 800 1000 1200 1400 1600
y x x y ~ ~ ~ ~ Beam halo trajectories The surface produced negative ions, which are launched from the side wall or the edge of the PG aperture, are over-focused due to the curvature of the edge of the meniscus. Since the electrostatic lens near the beam axis hardly focuses the negative ion beams, these negative ions have large divergent angles, and become the beam halo. EXG PG A2G ESG A1G GRG PG EXG 90 80 70 60 50 40 30 20 10 0 0 200 400 600 800 1000 1200 1400 1600
10 5 0 -5 -10 -15 10 20 30 40 50 60 70 80 90 x y ~ ~ 0.15 0.1 0.05 0 -0.05 -0.1 -0.15 10 20 30 40 50 60 70 80 90 Emittance diagrams 1 0.5 0 -0.5 -1 Line (b) Line (a) Divergence angle (rad) Divergence angle (rad) 10 20 30 40 50 60 70 80 90 y y ~ ~ PG ESG EXG Beam halo Beam core 90 80 70 60 50 40 30 20 10 0 Line (c) Divergence angle (rad) y ~ 60 80 100 120 140 160 180 200 220 240
Summary We have developed the integrated 2D PIC code for the analysis of the physics of the beam halo formation, which can simulate not only the source plasma with surface H- production, but also the H- acceleration self-consistently without any assumption of plasma meniscus. ・The simulation code reproduces a beam halo observed in an actual negative ion beams. ・The following physical mechanism of halo formation is shown: The negative ions extracted from the periphery of the meniscus are over-focused in the extractor due to large curvature of the meniscus. Theses ions are not focused by the electrostatic lenses in the accelerator, and consequently result in the beam halo. Future Plane The following optimization of the PIC model will be planed: ・Global 3D PIC model with the parallelization: more precise modeling electron loss along/across the field line, because the plasma meniscus strongly depends on it. ・Coupling of the PIC code with a Monte Carlo code (PIC-MCC) - surface production process via H atoms and H+ ions - H- destruction process, for example, mutual neutralization
The dependence of the plasma meniscus formation and beam halo on the physical parameters
Number of meshes X = 170, Y = 94 Size of meshes DX=DY=0.5 Length of time step 1 Time Step = t / 10 Number of particles H+: 1.0×10⁵ H‐: 1.0×10⁴ e: 9.0×10⁴ H- Ion Source Extraction region ~ Simulationmodel
I. Effect of negative ion current density on plasma meniscus Comparison of 2D profiles of H- ion density 3 H- surface production / time step 15 H- surface production / time step (a) (b) ~ y ~ ~ x x The penetration of the plasma meniscus is small under a large amount of H- surface production.
II. Effect of extraction voltage on plasma meniscus Comparison of 2D profiles of H- ion density Normalized EG potential: 120 Normalized EG potential: 180 (a) (b) ~ y ~ ~ x x As the extraction voltage is larger, the penetration of the plasma meniscus becomes larger as and consequently the fraction of the beam halo increases .
III. Effect of electron confinement on plasma meniscus • From the comparison without and with the magnetic filter, it is suggested that the fraction of beam halo depends on the electron density near the PG aperture. • The electron density depends on the effective electron confinement time in the source plasma. • In the present simulation, the effective electron confinement time can be varied by changing the parameter of . • The large value of means that the effective electron confinement time is long, and thus, the electron density near the PG aperture becomes high.
Comparison of 2D density profiles electron density negative ion density
In the case of the short effective electron confinement time, the penetration of the plasma meniscus into the source plasma becomes deep since the Debye shielding of the H- extraction electric field becomes small. Thus, the fraction of the beam halo increases. • The electron confinement time depends on the characteristic time of electron escape along the magnetic field as well as the characteristic time of electron diffusion across the magnetic field. Therefore, it is indicated that such parameters as the strength of the magnetic filter and the size of the arc chamber are important for the design of the negative ion sources to reduce the beam halo.
2D PIC simulation model (IV) ・The scale is normalized by the electron Debye length. Since this large different size between the electron Debye length and the real negative ion source will cause considerable high computation cost, the simulation model is scaled down. Lsim = s Lreal (s :scale factor) ・ The strengths of the applied voltages and the magnetic field are modeled followed by the scale down: Electric field Magnetic field (1) Extraction voltage The magnetic field in the simulation is given by the scale down of the Larmor radii of electrons: The extraction voltage is modeled in order to match the perveance for the real negative ion source. (2) Acceleration voltages The applied voltages in the accelerator are modeled to satisfy the law of scaling. V1 : voltage in the first gap (ESG-A1G) V2 : voltage in the second gap (A1G-A2G) V3 : voltage in the third gap (A2G-GRG) (6)
Beam optics study K. Miyamoto et al., in Proceeding of the joint meeting of the 7th International Symposium on the Production and Neutralization of Negative Ions and Beams and 6th European Workshop on the Production and Application of Light Negative Ions (Upton, New York, Oct. 23 ~ 27, 1995), AIP CONFERENCE PROCEEDINGS 380 (1996) pp. 390 ~ 396. JAEA Culham A. J. T. Holmes and M. P. S. Nightingale, Rev. Sci. Instrum., 57, 2402 (1986). Linear scale Linear scale Log scale Log scale


![Electron [and ion] beam studies of magnetic nanostructures](https://cdn2.slideserve.com/4692681/slide1-dt.jpg)