Download
1 / 22
220 likes | 223 Views
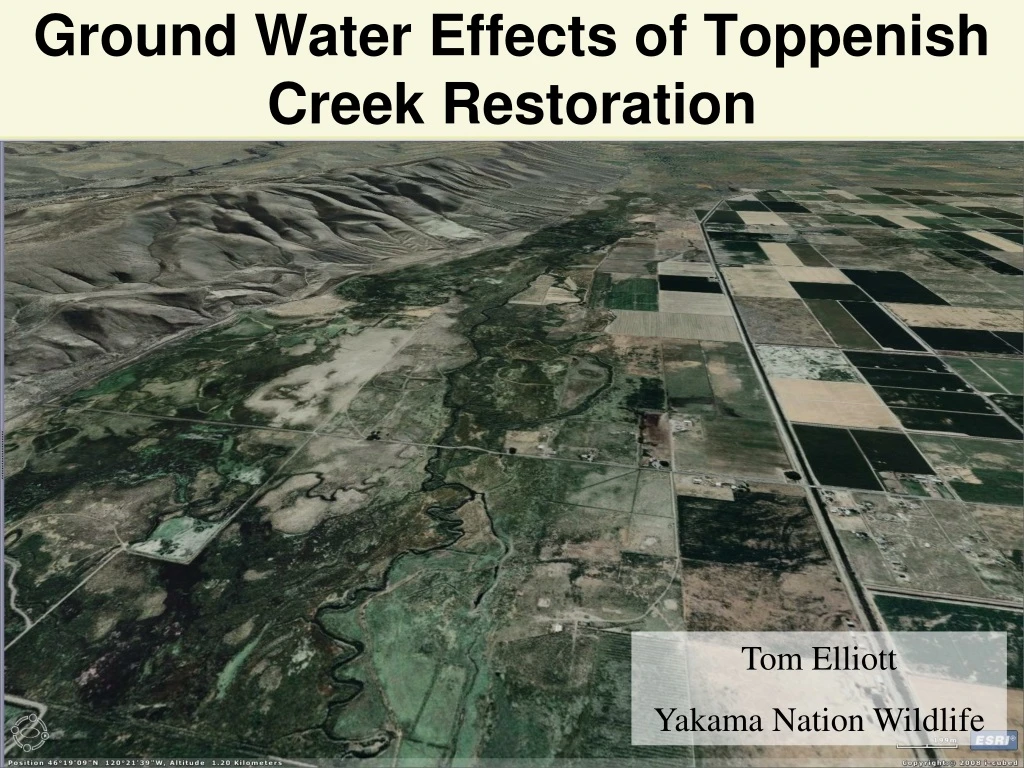
Ground Water Effects of Toppenish Creek Restoration. Tom Elliott. Tom Elliott Yakama Nation Wildlife. Project Area-Toppenish Creek on Yakama Reservation. Toppenish Creek 1909. Historical Context. Drastic land use changes over last 200 years- Beaver trapping Cattle and sheep grazing

E N D
Ground Water Effects of Toppenish Creek Restoration • Tom Elliott Tom Elliott Yakama Nation Wildlife
Project Area-Toppenish Creek on Yakama Reservation Toppenish Creek 1909
Historical Context Drastic land use changes over last 200 years- • Beaver trapping • Cattle and sheep grazing • Railroad and road development • Irrigated Agriculture
LiDAR Elevation Model 2005 channel
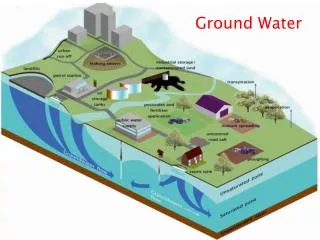
Floodplain Restoration Using Grade Control • Goals: • Reconnect previously active channels and floodplain • Spread flood waters • Raise water table for riparian habitat improvement
Monitoring Network Stream gage
Study Approach Did the project raise the floodplain water table relative to creek flows? • Collect and reduce data • Characterize groundwater interactions • Select wells that show creek influence • Compare water levels before and after project completion for selected wells • Project was completed in fall of 2006
Water table March 23 2009 Kriged using ArcMap Geostatistical Analyst
Well Data need to reduce!
Stream Stage Data project completed
Water levels before and after Average water levels in selected wells Toppenish Creek at Unit 2 average difference = 1.81 ft average difference = 0.26 ft average difference = 0.82 ft average difference = -0.17 ft 1.81 ft – 0.26 ft = 1.5 ft
Conclusions Grade control structures appear to have raised water table relative to upstream flow by at least 1 foot at low flow Project effects vary by well location The biological significance is likely to be positive Better data collection is necessary for future monitoring efforts
Works cited Reichmuth, D.R., Potter, A.S., and Reichmuth, M.G., 2007, Toppenish Basin Geomorphology, Geomax, P.C. Zar, J.H., 1999, Biostatistical Analysis, Fourth Edition: Upper Saddle River, New Jersey, Prentice-Hall, Inc., 798 p.