Download
1 / 36
410 likes | 684 Views
Dive into the science of sample extraction, identification, and quantitation. Learn through examples like the Human Genome Project and forensic science. Study classical wet chemical methods, statistical exercises, and instrumentation usage in a practical approach. Master techniques to determine purity levels in various samples and perform analyses using UV-Vis, AAS, and GC methodologies. Explore precision, significant figures, error propagation, statistical tools, and confidence intervals in practical analytical chemistry. Embrace hands-on learning and develop essential lab skills.

E N D
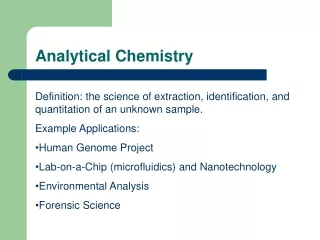
Analytical Chemistry Definition: the science of extraction, identification, and quantitation of an unknown sample. Example Applications: • Human Genome Project • Lab-on-a-Chip (microfluidics) and Nanotechnology • Environmental Analysis • Forensic Science
Course Philosophy • develop good lab habits and technique • background in classical “wet chemical” methods (titrations, gravimetric analysis, electrochemical techniques) • Quantitation using instrumentation (UV-Vis, AAS, GC)
Analyses you will perform • Basic statistical exercises • %purity of an acidic sample • %purity of iron ore • %Cl in seawater • Water hardness determination • UV-Vis: Amount of caffeine and sodium benzoate in a soft drink • AAS: %Cu in pre- and post-1982 pennies • GC: Gas phase quantitation using an internal standard titrations
Example, p. 19: Molarity of Salts in the Sea • Calculate molarity of 2.7 g NaCl/dL • [MgCl2] = 0.054 M. How many grams in 25 mL?
Dilution Equation Concentrated HCl is 12.1 M. How many milliliters should be diluted to 500 mL to make 0.100 M HCl? M1V1 = M2V2 (12.1 M)(x mL) = (0.100 M)(500 mL) x = 4.13 M
Chapter 3:Math Toolkit accuracy = closeness to the true or accepted value (given by the AVERAGE) precision = reproducibility of the measurement (given by the STANDARD DEVIATION)
Significant Figures • Digits in a measurement which are known with certainty, plus a last digit which is estimated beaker graduated cylinder buret
Rules for Determining How Many Significant Figures There are in a Number • All nonzero digits are significant (4.006, 12.012, 10.070) • Interior zeros are significant (4.006, 12.012, 10.070) • Trailing zeros FOLLOWING a decimal point are significant (10.070) • Trailing zeros PRECEEDING an assumed decimal point may or may not be significant • Leading zeros are not significant. They simply locate the decimal point (0.00002)
ans = 63.5 Reporting the Correct # of Sig Fig’s • Multiplication/Division 12.154 5.23 36462 24308 60770 Rule: Round off to the fewest number of sig figs originally present 63.56542
Reporting the Correct # of Sig Fig’s • Addition/Subtraction 15.02 9,986.0 3.518 10004.538 Rule: Round off to the least certain decimal place
Reporting the Correct # of Sig Fig’s • Addition/Subtraction in Scientific Notation Express all of the numbers with the same exponent first: 1.632 x 10⁵+ 4.107 x 10³+ 0.984 x 10⁶
Reporting the Correct # of Sig Fig’s • Logs and anti-logs
Rounding Off Rules • digit to be dropped > 5, round UP158.7 = 159 • digit to be dropped < 5, round DOWN158.4 = 158 • digit to be dropped = 5, make answer EVEN158.5 = 158.0 157.5 = 158.0 • BUT 158.501 = 159.000
? sig figs 5 sig figs 3 sig figs 1.235-1.02 0.215 = 0.22 Wait until the END of a calculation in order to avoid a “rounding error” (1.235 - 1.02) x 15.239 = 2.923438 = 1.12
Propagation of Errors A way to keep track of the error in a calculation based on the errors of the variables used in the calculation error in variable x1 = e1 = "standard deviation" (see Ch 4) e.g. 43.27 0.12 mL percent relative error = %e1 = e1*100 x1 e.g. 0.12*100/43.27 = 0.28%
Addition & Subtraction Suppose you're adding three volumes together and you want to know what the total error (et) is: 43.27 0.12 42.98 0.22 43.06 0.15 129.31 et
Gaussian Distribution: Fig 4.2
Mean – measure of the central tendency or average of the data (accuracy) N Infinite population Finite population Standard Deviation – measure of the spread of the data (reproducibility) Infinite population Finite population
Confidence Interval of the Mean The range that the true mean lies within at a given confidence interval True mean “” lies within this range x
Example - Calculating Confidence Intervals • In replicate analyses, the carbohydrate content of a glycoprotein is found to be 12.6, 11.9, 13.0, 12.7, and 12.5 g of carbohydrate per 100 g of protein. Find the 95% confidence interval of the mean. ave = 12.55, std dev = 0.465 N = 5, t = 2.776 (N-1) = 12.55 ± (0.465)(2.776)/sqrt(5) = 12.55 ± 0.58
Rejection of Data - the Grubbs Test A way to statistically reject an “outlier” Compare to Gcrit from a table at a given confidence interval. Reject if Gexp > Gcrit
Sidney: 10.2, 10.8, 11.6 Cheryl: 9.9, 9.4, 7.8 Tien: 10.0, 9.2, 11.3 Dick: 9.5, 10.6, 11.3
Linear Least Squares (Excel’s “Trendline”)- finding the best fit to a straight line