Download
1 / 22
220 likes | 305 Views
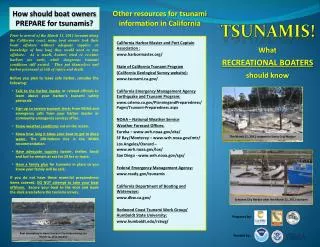
Instrumentation and Quantification of Tsunamis. With an Emphasis on the Santa Barbara Channel. Quantifying Earthquake & Tsunami Strength. Seismographs & seismometers—calculate magnitude, and epicenter Tide Gauges Run-up measurements Satellite Altimetry Numerical Model Simulations

E N D
Instrumentation and Quantification of Tsunamis With an Emphasis on the Santa Barbara Channel
Quantifying Earthquake & Tsunami Strength • Seismographs & seismometers—calculate magnitude, and epicenter • Tide Gauges • Run-up measurements • Satellite Altimetry • Numerical Model Simulations • ADVs, ADCPs, pressure gauges, etc on ocean floor
Proxies for Tsunami strength • Wave amplitude (Height) • Wave speed • Vertical/horizontal displacement by crustal plates • Seismic energy, wave energy and propagation
Seismology Data • Broadband Seismometers (top right) measure different frequency motion • Identify long-period events from far away, and local events • Detect all motions, including local landslides and distant earthquakes • Seismograph measure P and S waves. Difference in arrival time used to calcuate epicenter of earthquake • Use these data to issue Tsunami Warnings; takes ~5min • Data are also input into models for simulation of potential Tsunami
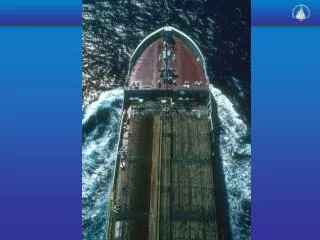
Tidal Gauges • Tide gauges (top) and Buoys (bottom) often provide first confirmation of tsunami generation. • Buoys with bottom pressure sensors contribute real-time data to Tsunami warning system • Tide gauges measure changes in pressure relative to mean trends and bottom depth • Problems: not all tide gauges sample at same frequency—ever 2 min, 6 min, 30 min, etc. varies by location
Schematic of Tide Gauge (left) and deployed Tide Gauge (right)
Deep-ocean Assessment and Reporting of Tsunamis (DART) • ~39 Surface buoys with bottom pressure sensors • Conversion factor ~10dbar = 10 meters • DARTS also incorporates data ~400 tide gauges worldwide. • DARTS transmit data every 15 min; during Tsunami warning data is time averaged every minute and transmitted every 8 minutes
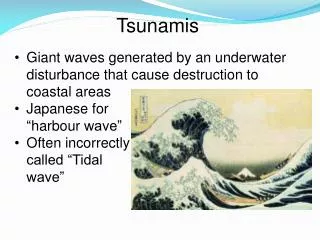
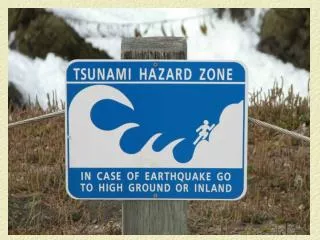
Terrestrial run-up and inundation by tsunamis • Tsunamis behave like shallow-water waves because of long wavelength; used to forecast inundation and amplitude of waves by modelers • By knowing ocean bathymetry, wave speed can be predicted, giving estimate of arrival time on land
Short-term Inundation Forecast for Tsunamis (SIFT) • Developed by NOAA Pacific Marine Environmental Laboratory, or PMEL, to predict tsunami propagation • Model uses seismological data and DARTS data to predict impact on different coastal locations
MOST (method of splitting tsunami) model • Numerical model that uses forecast techniques and real-time data • Incorporates satellite altimetry data, tide gauge data, and seismographic data • seafloor displacement, horizontal extent of displacement, and its location are most important for determining propagation
Offshore Southern California Tsunamigenic Hazards • Several active submarine thrust fault systems • The walls of the basin forming the channel are susceptible to submarine slope failures
Historical Tsunamis and Earthquakes Offshore Southern California • December 21, 1812 • Affected over 60km of the coast • ~7.2 magnitude – one of the largest in California history • Runup: 4m at El Refugio, ~2m in SB and Ventura, possibly a 4m in Kona, Hawaii • “the sea receded and rose like a high mountain” • Residents relocated their settlements further inland after the tsunami
Historical Tsunamis and Earthquakes Offshore Southern California • November 4, 1927 – Point Arguello-Lompoc • Largest and best observed locally generated tsunami • Magnitude ~7.0 • Offshore thrust or oblique-reverse fault west of Pt. Conception • Runup: 2m at Surf • Exceptionally high tide elsewhere
Santa Barbara Basin & the Goleta slide Submerged extension of the Ventura Basin • Goleta slide: • 9 miles x 6.5 miles • Steep slide from 300 ft to >1800 ft • Slopes as steep as 45 deg • 8-10 kilo annum years ago Cause of concern because of oil drilling!
Triggers Landslide Landslide to Tsunami Water depth: too deep, and landslide would propagate southward waves Landslide volume: all or part of the remaining volume of the Goleta slide could potentially fail Landslide speed: 20-125 m/s are required to trigger a tsunami Potential runup: 2-20m of 10km shoreline • Major earthquakes are the most obvious landslide triggers • Subsurface fluid flow • The rate of sediment accumulation in the shelf-edge delta • Destabilizing influence of structural growth • 30-40% probability of landslide in next 60,000 years Good news: Goleta slide is relatively stable!