Download
1 / 33
350 likes | 887 Views
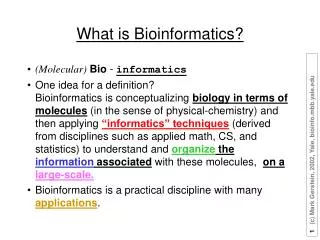
What is Bioinformatics?. (Molecular) Bio - informatics

E N D
What is Bioinformatics? • (Molecular)Bio - informatics • One idea for a definition?Bioinformatics is conceptualizing biology in terms of molecules (in the sense of physical-chemistry) and then applying “informatics” techniques (derived from disciplines such as applied math, CS, and statistics) to understand and organize the information associated with these molecules, on a large-scale. • Bioinformatics is a practical discipline with many applications.
Bioinformatics Subtopics SecondaryStructurePrediction FoldRecognition HomologyModeling Docking &Drug Design E-literature FunctionClass-ification SequenceAlignment Expression Clustering ProteinGeometry DatabaseDesign GenePrediction Large-ScaleGenomicSurveys ProteinFlexibility StructureClassification GenomeAnnotation
Databases Building, Querying Data Dictionaries Object Oriented DB Google Text String Comparison Text Search 1D Alignment Significance Statistics, E_val Alta Vista, grep Finding Patterns AI / Machine Learning Clustering Datamining Graph Theory, Networks Constraint Propagation Geometry Robotics Graphics (Surfaces, Volumes) Comparison and 3D Matching Docking Physical Simulation Newtonian Mechanics Electrostatics Numerical Algorithms Simulation Statistics Traditional tests Inferential, Bayesian Information retrieval General Types of “Informatics” techniquesin Bioinformatics
Databases NCBI GenBank- Protein and DNA sequence NCBI Human Map - Human Genome Viewer NCBI Ensembl - Genome browsers for human, mouse, zebra fish, mosquito TIGR - The Institute for Genome Research SwissProt - Protein Sequence and Function ProDom - Protein Domains Pfam - Protein domain families ProSite - Protein Sequence Motifs Protein Data Base (PDB) - Coordinates for Protein 3D structures SCOP Database- Domain structures organized into evolutionary families HSSP - Domain database using Dali FlyBase WormBase PubMed / MedLine Sequence Alignment Tools BLAST Clustal FASTA PSI-Blast Hidden Markov Models 3D Structure Alignments / Classifications Dali VAST PRISM CATH SCOP Some Specific “Informatics” toolsof Bioinformatics
Raw Data ???T C A T G C A T T G 2 matches, 0 gaps T C A T G | |C A T T G 3 matches (2 end gaps) T C A T G . | | | . C A T T G 4 matches, 1 insertion T C A - T G | | | | . C A T T G 4 matches, 1 insertion T C A T - G | | | | . C A T T G Aligning Text Strings
Each sequence alignment has a “bit score” or “similarity score” (S), a measure of the similarity between the hit and the query; normalized for “effective length" The E-value of the hit is the number of alignments in the database you are searching with similarity score ≥ S that you expect to find by chance; liklihood of the match relative to a pair of random sequences with the same amino acid composition E = 10-50. Much more likely than a random occurrence E = 10-5. This could be an accidental event E = 1. It is easy to find another hit in the database that is as The lower the Expect Value (E_val), the more significant the “hit” Sequence Alignment E-value: Expect Value
Similarity Score (Bit Score): Higher similarity score (% seq id) corresponds to smaller E-value Length of the query: Since a particular Similarity Score is more easily obtained by chance with a longer query sequence, longer queries correspond to larger E-values Size of the database: Since a larger database makes a particular Similarity Score easier to obtain, a larger database results in larger E-values E-value Expect ValueDepends on:
Raw Score: calculated by counting the number of identities, mismatches, gaps, etc in the alignment Bit Score: Normalizes the “raw score” to provide a measure of sequence similarity that is independent of the scoring system E-value: E = mn2-S where m - “effective length of the query” (accounts for the fact that ends may not line up); n - length of the database (number of residues or bases) S - Bit score Calculating E-val:
Blast against Structural Genomic Target Registry (TargetDB) or against latest PDB or PDB-on-hold listings
The Score S = Total Score S(i,j) = similarity matrix score for aligning i and j Sum is carried out over all aligned i and j n = number of gaps (assuming no gap ext. penalty) G = gap penalty Simplest score (for identity matrix) is S = # matches What does a Score of 10 mean? What is the Right Cutoff?
Basic Alignment via Dynamic Programming Suboptimal Alignment Gap Penalties Similarity (PAM) Matrices Multiple Alignment Profiles, Motifs, HMMs Global vs Local Alignment Basic Concepts of Sequence Alignment
Molecular Biology Information: Protein Sequence • 20 letter alphabet • ACDEFGHIKLMNPQRSTVWY but not BJOUXZ • Strings of ~300 aa in an average protein (in bacteria), ~200 aa in a domain • ~200 K known protein sequences d1dhfa_ LNCIVAVSQNMGIGKNGDLPWPPLRNEFRYFQRMTTTSSVEGKQ-NLVIMGKKTWFSI d8dfr__ LNSIVAVCQNMGIGKDGNLPWPPLRNEYKYFQRMTSTSHVEGKQ-NAVIMGKKTWFSI d4dfra_ ISLIAALAVDRVIGMENAMPWN-LPADLAWFKRNTL--------NKPVIMGRHTWESI d3dfr__ TAFLWAQDRDGLIGKDGHLPWH-LPDDLHYFRAQTV--------GKIMVVGRRTYESF d1dhfa_LNCIVAVSQNMGIGKNGDLPWPPLRNEFRYFQRMTTTSSVEGKQ-NLVIMGKKTWFSI d8dfr__ LNSIVAVCQNMGIGKDGNLPWPPLRNEYKYFQRMTSTSHVEGKQ-NAVIMGKKTWFSI d4dfra_ ISLIAALAVDRVIGMENAMPW-NLPADLAWFKRNTLD--------KPVIMGRHTWESI d3dfr__ TAFLWAQDRNGLIGKDGHLPW-HLPDDLHYFRAQTVG--------KIMVVGRRTYESF d1dhfa_ VPEKNRPLKGRINLVLSRELKEPPQGAHFLSRSLDDALKLTEQPELANKVDMVWIVGGSSVYKEAMNHP d8dfr__ VPEKNRPLKDRINIVLSRELKEAPKGAHYLSKSLDDALALLDSPELKSKVDMVWIVGGTAVYKAAMEKP d4dfra_ ---G-RPLPGRKNIILS-SQPGTDDRV-TWVKSVDEAIAACGDVP------EIMVIGGGRVYEQFLPKA d3dfr__ ---PKRPLPERTNVVLTHQEDYQAQGA-VVVHDVAAVFAYAKQHLDQ----ELVIAGGAQIFTAFKDDV d1dhfa_ -PEKNRPLKGRINLVLSRELKEPPQGAHFLSRSLDDALKLTEQPELANKVDMVWIVGGSSVYKEAMNHP d8dfr__ -PEKNRPLKDRINIVLSRELKEAPKGAHYLSKSLDDALALLDSPELKSKVDMVWIVGGTAVYKAAMEKP d4dfra_ -G---RPLPGRKNIILSSSQPGTDDRV-TWVKSVDEAIAACGDVPE-----.IMVIGGGRVYEQFLPKA d3dfr__ -P--KRPLPERTNVVLTHQEDYQAQGA-VVVHDVAAVFAYAKQHLD----QELVIAGGAQIFTAFKDDV
Raw Data ???T C A T G C A T T G 2 matches, 0 gaps T C A T G | |C A T T G 3 matches (2 end gaps) T C A T G . | | | . C A T T G 4 matches, 1 insertion T C A - T G | | | | . C A T T G 4 matches, 1 insertion T C A T - G | | | | . C A T T G Aligning Text Strings
Dynamic Programming • What to do for Bigger String? SSDSEREEHVKRFRQALDDTGMKVPMATTNLFTHPVFKDGGFTANDRDVRRYALRKTIRNIDLAVELGAETYVAWGGREGAESGGAKDVRDALDRMKEAFDLLGEYVTSQGYDIRFAIEP KPNEPRGDILLPTVGHALAFIERLERPELYGVNPEVGHEQMAGLNFPHGIAQALWAGKLFHIDLNGQNGIKYDQDLRFGAGDLRAAFWLVDLLESAGYSGPRHFDFKPPRTEDFDGVWAS • Needleman-Wunsch (1970) provided first automatic method • Dynamic Programming to Find Global Alignment • Their Test Data (J->Y) • ABCNYRQCLCRPMAYCYNRCKCRBP
Step 1 -- Make a Dot Plot (Similarity Matrix) Put 1's where characters are identical.
A More Interesting Dot Matrix (adapted from R Altman)
Step 2 -- Start Computing the Sum Matrix new_value_cell(R,C) <= cell(R,C) { Old value, either 1 or 0 } + Max[ cell (R+1, C+1), { Diagonally Down, no gaps } cells(R+1, C+2 to C_max),{ Down a row, making col. gap } cells(R+2 to R_max, C+1) { Down a col., making row gap } ]
Step 4 -- Sum Matrix All Done Alignment Score is 8 matches.
Step 5 -- Traceback Find Best Score (8) and Trace BackA B C N Y - R Q C L C R - P MA Y C - Y N R - C K C R B P
Step 6 -- Alternate Tracebacks A B C - N Y R Q C L C R - P MA Y C Y N - R - C K C R B P Also, Suboptimal Aligments
Gap Penalties The score at a position can also factor in a penalty for introducing gaps (i. e., not going from i, j to i- 1, j- 1). Gap penalties are often of linear form: GAP = a + bN GAP is the gap penalty a = cost of opening a gap b = cost of extending the gap by one (affine) N = length of the gap (Here assume b=0, a=1/2, so GAP = 1/2 regardless of length.)
Step 2 -- Computing the Sum Matrix with Gaps new_value_cell(R,C) <= cell(R,C) { Old value, either 1 or 0 } + Max[ cell (R+1, C+1), { Diagonally Down, no gaps } cells(R+1, C+2 to C_max) - GAP ,{ Down a row, making col. gap } cells(R+2 to R_max, C+1) - GAP { Down a col., making row gap } ] GAP =1/2 1.5
ACSQRP--LRV-SH RSENCVA-SNKPQLVKLMTH VKDFCV ACSQRP--LRV-SH -R SENCVA-SNKPQLVKLMTH VK DFCV Key Idea in Dynamic Programming • The best alignment that ends at a given pair of positions (i and j) in the 2 sequences is the score of the best alignment previous to this position PLUS the score for aligning those two positions. • An Example Below • Aligning R to K does not affect alignment of previous N-terminal residues. Once this is done it is fixed. Then go on to align D to E. • How could this be violated? Aligning R to K changes best alignment in box.
Substitution Matrices • Count number of amino acid identities (or non-identities) • Count the minimum number of mutations in the DNA needed to account for the non-identical pairs • Provide some measure of similarity based on frequency of mutations observed in homologous protein sequences
Similarity (Substitution) Matrix A R N D C Q E G H I L K M F P S T W Y V A 4 -1 -2 -2 0 -1 -1 0 -2 -1 -1 -1 -1 -2 -1 1 0 -3 -2 0 R -1 5 0 -2 -3 1 0 -2 0 -3 -2 2 -1 -3 -2 -1 -1 -3 -2 -3 N -2 0 6 1 -3 0 0 0 1 -3 -3 0 -2 -3 -2 1 0 -4 -2 -3 D -2 -2 1 6 -3 0 2 -1 -1 -3 -4 -1 -3 -3 -1 0 -1 -4 -3 -3 C 0 -3 -3 -3 8 -3 -4 -3 -3 -1 -1 -3 -1 -2 -3 -1 -1 -2 -2 -1 Q -1 1 0 0 -3 5 2 -2 0 -3 -2 1 0 -3 -1 0 -1 -2 -1 -2 E -1 0 0 2 -4 2 5 -2 0 -3 -3 1 -2 -3 -1 0 -1 -3 -2 -2 G 0 -2 0 -1 -3 -2 -2 6 -2 -4 -4 -2 -3 -3 -2 0 -2 -2 -3 -3 H -2 0 1 -1 -3 0 0 -2 7 -3 -3 -1 -2 -1 -2 -1 -2 -2 2 -3 I -1 -3 -3 -3 -1 -3 -3 -4 -3 4 2 -3 1 0 -3 -2 -1 -3 -1 3 L -1 -2 -3 -4 -1 -2 -3 -4 -3 2 4 -2 2 0 -3 -2 -1 -2 -1 1 K -1 2 0 -1 -3 1 1 -2 -1 -3 -2 5 -1 -3 -1 0 -1 -3 -2 -2 M -1 -1 -2 -3 -1 0 -2 -3 -2 1 2 -1 5 0 -2 -1 -1 -1 -1 1 F -2 -3 -3 -3 -2 -3 -3 -3 -1 0 0 -3 0 6 -4 -2 -2 1 3 -1 P -1 -2 -2 -1 -3 -1 -1 -2 -2 -3 -3 -1 -2 -4 6 -1 -1 -4 -3 -2 S 1 -1 1 0 -1 0 0 0 -1 -2 -2 0 -1 -2 -1 4 1 -3 -2 -2 T 0 -1 0 -1 -1 -1 -1 -2 -2 -1 -1 -1 -1 -2 -1 1 5 -2 -2 0 W -3 -3 -4 -4 -2 -2 -3 -2 -2 -3 -2 -3 -1 1 -4 -3 -2 10 2 -3 Y -2 -2 -2 -3 -2 -1 -2 -3 2 -1 -1 -2 -1 3 -3 -2 -2 2 6 -1 V 0 -3 -3 -3 -1 -2 -2 -3 -3 3 1 -2 1 -1 -2 -2 0 -3 -1 4 • Identity Matrix • Match L with L => 1Match L with D => 0Match L with V => 0?? • S(aa-1,aa-2) • Match L with L => 1Match L with D => 0Match L with V => .5 • Number of Common Ones • PAM • Blossum • Gonnet
+ —> More likely than random 0 —> At random base rate - —> Less likely than random Where do matrices come from? • Manually align protein structures(or, more risky, sequences) 2 Look at frequency of a.a. substitutionsat structurally constant sites. -- i.e. pair i-j exchanges 3 Compute log-odds S(aa-1,aa-2) = log2 ( freq(O) / freq(E) ) O = observed exchanges, E = expected exchanges • odds = freq(observed) / freq(expected) • Sij = log odds • freq(expected) = f(i)*f(j) = is the chance of getting amino acid i in a column and then having it change to j • e.g. A-R pair observed only a tenth as often as expected 90% AAVLL… AAVQI… AVVQL… ASVLL… 45%
1978 1991 L 0.085 0.091 A 0.087 0.077 G 0.089 0.074 S 0.070 0.069 V 0.065 0.066 E 0.050 0.062 T 0.058 0.059 K 0.081 0.059 I 0.037 0.053 D 0.047 0.052 R 0.041 0.051 P 0.051 0.051 N 0.040 0.043 Q 0.038 0.041 F 0.040 0.040 Y 0.030 0.032 M 0.015 0.024 H 0.034 0.023 C 0.033 0.020 W 0.010 0.014 Amino Acid Frequencies of Occurrence
Relationship of type of substitution to closeness in identity of the sequences in the training alignment
Different Matrices are Appropriate at Different Evolutionary Distances (Adapted from D Brutlag, Stanford)
PAM-250 (distant) Change in Matrix with Ev. Dist. PAM-78 (Adapted from D Brutlag, Stanford)
- Simplest way: the identity matrix - A very crude model : to use the genetic code matrix, the number of point mutations necessary to transform one codon into the other. Other similarity scoring matrices might be constructed from any property of amino acids that can be quantified -partition coefficients between hydrophobic and hydrophilic phases -charge -molecular volume, etc. Unfortunately, all these biophysical quantities suffer from the fact that they provide only a partial view of the picture - there is no guarantee, that any particular property is a good predictor for conservation of amino acids between related proteins. Other Matrices:How to score the exchange of two amino acids in an alignment? (graphic adapted from W Taylor)
Some concepts challenged: Are the evolutionary rates uniform over the whole of the protein sequence? (No.) The BLOSUM matrices: Henikoff & Henikoff (Henikoff, S. & Henikoff J.G. (1992) PNAS89:10915-10919) . Use blocks of sequence fragments from different protein families which can be aligned without the introduction of gaps. Amino acid pair frequencies can be compiled from these blocks Different evolutionary distances are incorporated into this scheme with a clustering procedure: two sequences that are identical to each other for more than a certain threshold of positions are clustered. More sequences are added to the cluster if they are identical to any sequence already in the cluster at the same level. All sequences within a cluster are then simply averaged. (A consequence of this clustering is that the contribution of closely related sequences to the frequency table is reduced, if the identity requirement is reduced. ) This leads to a series of matrices, analogous to the PAM series of matrices. BLOSUM80: derived at the 80% identity level. The BLOSUM Matrices BLOSUM62 is the BLAST default