Download
1 / 36
370 likes | 535 Views
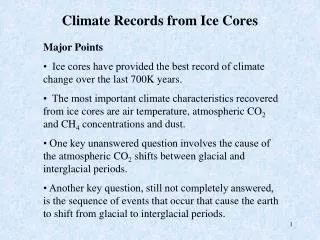
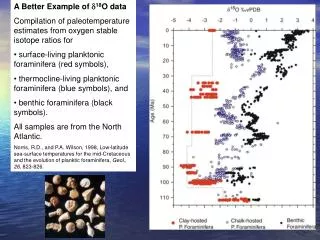
d 18 O records Ice Volume. Every 10-m change in sea level produces an ~0.1 ‰ change in d 18 O of benthic foraminifer The age of most prominent d 18 O minima Correspond with ages of most prominent reef recording sea level high stands Absolute sea levels estimates from reefs

E N D
d18O records Ice Volume • Every 10-m change in sea level produces an ~0.1‰ change in d18O of benthic foraminifer • The age of most prominent d18O minima • Correspond with ages of most prominent reef recording sea level high stands • Absolute sea levels estimates from reefs • Correspond to shifts in d18O • Reef sea level record agreement with assumption of orbital forcing • 125K, 104K and 82K events forced by precession
Astronomical d18O as a Chronometer • Relationship between orbital forcing and d18O so strong • d18O values can orbitally tune sediment age • Constant relationship in time between insolation and ice volume • Constant lag between insolation change and ice volume change • Date climate records in ocean sediments • In relation to the known timing of orbital changes
Orbital Tuning • 41,000 and 23,000 year cycles from astronomically dated insolation curves • Provide tuning targets • Similar cycles embedded in the d18O ice volume curves are matched and dated • Now most accurate way to date marine sediments
Orbital-Scale Change in CH4 & CO2 • Important climate records from last 400 kya • Direct sampling of greenhouse gases in ice • Critical questions must be addressed • Before scale of variability in records determined • Reliability of age dating of ice core? • Mechanisms and timing of gas trapping? • Accuracy of the record? • How well gases can be measured? • How well do they represent atmospheric compositions and concentrations?
Vostok Climate Records • Illustrates strong correlation between paleotemperature and the concentration of atmospheric greenhouse gases • Concentrations of CO2 and CH4 moved in tandem with paleotemperatures derived from stable isotope records • Mechanisms of relationships poorly understood • To what extent did higher greenhouse gases cause greater radiative warming of the Earth's atmosphere?
Dating Ice Core Records • Ice sheets thickest in center • Ice flow slowly downward • Then flows laterally outward • Annual layers may be preserved and counted • Deposition of dust during winter • Blurred at depth due to ice deformation
Reliability of Dating • Dust layer counting • Best when ice deposition rapid • Greenland ice accumulates at 0.5 m y-1 • Layer counting good to 10,000 years • Antarctica ice accumulates at 0.05 m y-1 • Layering unreliable due to slow deposition • Where unreliable, ice flow models used • Physical properties of ice • Assumes smooth steady flow • Produces “fairly good estimates” of age
Dust Layers • Greenland has two primary sources for dust • Particulates from Arctic Canada and coastal Greenland • Large volcanic eruptions anywhere on the globe
Gas Trapping in Ice • Gases trapped during ice sintering • When gas flow to surface shut down • Crystallization of ice • Depths of about 50 to 100 m below surface • Gases younger than host ice • Fast accumulation minimizes age difference (100 years) • Slow deposition maximizes age difference (1000-2000 years)
Implication of Age Difference • If change in greenhouse gas concentrations • Force changes in ice volume • Gas concentration should lead ice volume • Gas age is younger than ice age • Therefore offset between changes in atmospheric gas concentrations • Which should be relatively rapid • Closer to change in ice volume • Which should be relatively slow
Reliability and Accuracy of Records • Can be evaluated by comparing instrumental record • With records from rapidly accumulating ice sheets • Instrumental records date to 1958 for CO2 and 1983 for CH4 • Mauna Loa Observatory (David Keeling)
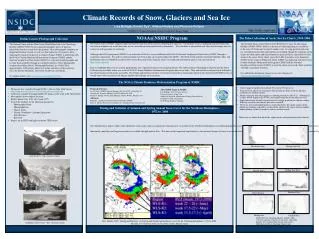
NOAA/CMDL Air Sampling Network 35 Sampling stations or about half world-wide stations
Carbon Dioxide • Measurements of CO2 concentration • Core from rapidly accumulating ice • Merge well with instrumental data
Methane • Measurements of CH4 concentration • Core from rapidly accumulating ice • Merge well with instrumental data
CH4 and CO2 in Ice Cores • Given agreement between records from rapidly accumulating ice • Instrumental data • Accuracy and variability about the trends • Assume that longer-term records collected from ice cores • Reliable for determining the scale of variability
Orbital-Scale Changes in CH4 • CH4 variability • Interglacial maxima 550-700 ppb • Glacial minima 350-450 ppb • Five cycles apparent in record • 23,000 precession period • Dominates low-latitude insolation • Resemble monsoon signal • Magnitude of signals match
Monsoon forcing of CH4 • Match of high CH4 with strong monsoon • Strongly suggests connection • Monsoon fluctuations in SE Asia • Produce heavy rainfall, saturate ground • Builds up bogs • Organic matter deposition and anaerobic respiration likely • Bogs expand during strong summer monsoon • Shrink during weak summer monsoon
Alternative Explanation • High-latitude soils and continental margins source of atmospheric methane • CH4 stored in frozen soils (permafrost) • Continental margin sediments (hydrates) • Released during exceptionally warm summers • Precessional changes in summer insolation affects high latitudes • Cycles of summer warming should also occur on 41,000 year cycles • Lack of 41,000 cycle in record argues against high latitude source
Orbital-Scale Changes in CO2 • CO2 record from Vostok • Interglacial maxima 280-300 ppm • Glacial minima 180-190 ppm • 100,000 year cycle dominant • Match ice volume record • Timing • Asymmetry • Abrupt increases in CO2 match rapid ice melting • Slow decreases in CO2 match slow build-up of ice
Orbital-Scale Changes in CO2 • Vostok 150,000 record • 23,000 and 41,000 cycles • Match similar cycles in ice volume • Agreement suggests cause and effect relationship • Relationship unknown • e.g., does CO2 lead ice volume? • Correlations not sufficient to provide definite evaluation
Problems with Records • Ice cores poorly dated • CO2 older than ice by variable amount • Greenland ice core well-dated (dust layers) • Dust is CaCO3-rich • Dissolution of CaCO3 releases CO2 • Precise timing between changes in CO2 and ice volume uncertain • New data provide better correlation • Data do show that signals correlate • Some causal link must exist • Big question – how did CO2 vary by 30%?
Covariation Between CO2 and dD If the dD change reflects a proportional T drop, then more than ½ of the interglacial-to-glacial change occurred before significant removal of atmospheric CO2 • Substantial mismatch in Vostok records (r2 = 0.64 over the last 150 kya) Values shown normalized to their mean values during the mid-Holocene (5–7 kya BP) and the last glacial (18–60 kya BP) Clearly visible are the disproportionately low deuterium values during the mid-glacial (60–80 Kya BP), the glacial inception (95–125 Kya BP), and the penultimate glacial maximum (140– 150 Kya BP)
Temperature from Ice Cores • Snow falling on ice sheets under colder temperatures is more negative • A plot of the 18O of snow versus temperature shows an excellent correlation • Thus 18O serves as a paleothermometer
d18O in Ice Cores • Several factors in addition to temperature of precipitation • Affect the d18O of snow and ice on glaciers
Meteoric Water Line • dD and d18O in precipitation correlated • Determined by evaporation/precipitation and rainout • Mixture of equilibrium and non-equilibrium processes • Deuterium excess (d = dD – 8d18O) quantifies intercept and disequilibria
Deuterium Excess in Marine Rain • Deuterium-excess value in marine environments • Established at the site of the air-sea interaction • The offset from equilibrium conditions • Determined by the humidity deficit above the sea surface • This deuterium-excess value is conserved during the rainout over the continents • If humidity deficit is known or can be modeled • Can be used to correct dD/d18O of precipitation • Determine more precisely ambient temperature during precipitation
dD on Antarctica • Determine by the temperature, humidity and dD of the vapor source region • Cuffy and Vimeux (2001, Nature, 415:523-527) showed using deuterium excess • Mismatch is an artifact caused by variations in climate of the vapor source region • Used a climate model and measured deuterium excess • Calculate Southern Hemisphere temperature variations
Vostok Temperature and CO2 • Deuterium excess corrected Southern Hemisphere temperature correlate remarkably well with CO2 variations Covariation of CO2 and temperature have r2 = 0.89 for last 150 kya and r2 = 0.84 for last 350-400 kya
Implications of Results • CO2 is an important climate forcing on the Modern Earth • Long-term synchrony of glacial-interglacial cycling • Between Northern and Southern Hemispheres • Due to greenhouse gas variations and feedbacks associated with variations • Southern Hemisphere DT explained by • CO2 variations • Without considering changes in N. Hemisphere insolation • Delay between CO2 decrease and DT • During last glacial inception only ~5,000 years
Unresolved Issues • Cuffy and Vimeux (2001) show that • 90% of DT can be explained by variations in CO2 and CH4 • Reasonably firm grasp on causes of CH4 variations (Monsoon forcing) • What produced CO2 variations? • Variations are large – 30% • Show rapid changes – drop of 90 ppm from interglacial to glacial
Physical Oceanographic Changes in CO2 90% of the CO2 decrease unexplained by physical processes • During glaciations physical properties change • Temperature and salinity • Affect solubility of CO2(aq) and thus pCO2
Exchange of Carbon • Carbon in rock reservoir exchanges slowly • Cannot account for 90 ppm change in 103 y • Rapid exchange of carbon must involve near-surface reservoirs
Changes in Soil Carbon • Expansion of ice sheets • Covered or displaced forests • Coniferous and deciduous trees • Displaced forests replaced by steppes and grasslands • Have lower carbon biomass • Pollen records in lakes • Indicate glacial times were dryer and less vegetated than interglacial • Estimates of total vegetation reduced by 25% (15-30%) during glacial maxima • CO2 removed from atmosphere did not go into vegetation on land!
Where is the Missing Carbon? • Carbon from reduced CO2 during glacial times • Not explained by physical properties of surface ocean • Did not go into biomass on land • Must have gone into oceans • Surface ocean not likely • Exchanges carbon with atmosphere too rapidly • Most areas of ocean within 30 ppm of atmosphere • Glacial surface ocean must also have been lower, like atmosphere • Deep ocean only likely remaining reservoir