Download
1 / 41
410 likes | 518 Views
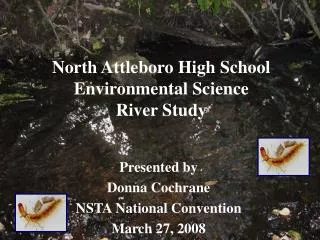
Abbott Run Annual Study 2009. North Attleboro High School Presented 4/30/09 Bridgewater State College. Purpose of Study. - The purpose of our study is to examine whether or not the water in Abbott Run is suitable to be Pawtucket, Rhode Island’s drinking water.

E N D
Abbott Run Annual Study 2009 North Attleboro High School Presented 4/30/09 Bridgewater State College
Purpose of Study -The purpose of our study is to examine whether or not the water in Abbott Run is suitable to be Pawtucket, Rhode Island’s drinking water. -We checked for fecal coliform colonies, dissolved oxygen, the river flow, precipitation levels, pH, the benthic macro-invertebrates diversity, depth of the river sites, and temperature to see if the river would meet the standards of Massachusetts. -In Massachusetts, a river source must meet the Class A standards to be used for drinking water.
Abbott Run Watershed Abbott Run
There was a furnace built on the west side of the river and was called Iron Rust. Cannons were made here during the Revolution. Abbott Run is the water source for Pawtucket, RI and Cumberland, RI and has been for centuries. Robin Hollow, one of the first manufacturing sites in Cumberland, was located on Abbott Run. The first manufacturing done at Abbott Run was during the time of Charles II when a royal license was obtained to manufacture tar. There was a Girl Scout camp on the river called Camp Shady Pines. There was construction of Hunts Bridge near Abbott Run, Site B during 2006 which has disturbed the pH of the water. History of Abbott Run
Map of Abbott Run Sites A and B Shady Pines Site B Cushman Road Site A
Site B Shady Pines Site A Cushman Road Topographic Map of Abbott Run Sites A and B
Site A Site A
Seven Day Precipitation Graph for North Attleboro 22 23 24 25 26 27 28 29
Stream Profile Cushman Road, Site A 10/29/08 0 2 4 6 8 10 12 14 16 18 20 22 24 26 28 30 32 34 36 38 -0.2 -0.4 -0.6 -0.8 -1 Width (feet) -1.2 -1.4 -1.6 -1.8 -2 Depth (feet)
Shady Pines Stream Profile, Site B, 10/29/08 0 0 1 2 3 4 5 6 7 8 9 10 11 12 13 -0.2 -0.4 -0.6 Depth (feet) -0.8 -1 -1.2 -1.4 -1.6 Width (feet)
Average Flow, Stream Width, Depth, Total Discharge,and Bottom Composition Site A Cushman Road Site B Shady Pines
pH Comparison of Site A, Cushman Road and Site B, Shady Pines-October 29-30, 2008 Site B Shady Pines Site A Class A Water Standard: pH between 6.5 and 8.3
Site A Cushman Road pH Comparison 2005-2008 Class A Water Standard: pH between 6.5 and 8.3
Site B Shady Pines pH Comparison 2005-2008 Class A Water Standard: pH between 6.5 and 8.3
Dissolved Oxygen Comparison Site A Cushman Road and Site B Shady Pines-October 29, 2008-October 30, 2008 Cushman Road Shady Pines Class A Water Standards: Dissolved Oxygen isno less than 6 mg/l, unless background conditions are lower
Dissolved Oxygen Comparison Site A Cushman Road 2005-2008 Class A Water Standards: Dissolved Oxygen isno less than 6 mg/l, unless background conditions are lower
Dissolved Oxygen Comparison Site B Shady Pines 2005-2008 Class A Water Standards: Dissolved Oxygen isno less than 6 mg/l, unless background conditions are lower
Temperature Comparison Abbott Run Site A and Site B, 10/29/08-10/30/08 Site B Shady Pines Site A Cushman Rd. Class A Water Standards: Temperature shall not exceed 28.3° C
Temperature Comparison Abbott Run Site A Cushman Rd. 2005-2008
Temperature Comparison Abbott Run Site B Shady Pines, 2005-2008
% DO Comparison Abbott Run Sites A & B 10/29/08-10/30/08 Site A Cushman Rd Site B Shady Pines Class A Standard: %DO not less than 75%
Specific Conductivity Comparison “…natural conductivity level without human influence would be around 0.05mS/cm or less. The levels in the 0.3 – 0.4mS/cm range indicate likely contamination from salt and or wastewater.”–Doug Heath, EPA Conductivity (mS/cm) Time (Hours)
Specific Conductivity ComparisonSite A Cushman Road Conductivity (mS/cm) Time (Hours)
Specific Conductivity ComparisonSite B Shady Pines Conductivity (mS/cm) Time (Hours)
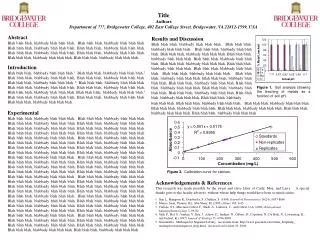
Ranges and Averages from Cushman Road, 10/29/08
Range Average 9.07-6.36 7.94 Temperature (C) pH 7.46-6.96 7.01 Specific Conductivity mS/cm 0.211-0.207 0.21 Dissolved Oxygen (mg/l) 12.42-11.30 11.71 % Dissolved Oxygen (%Sat) 103.10-97.30 98.49 Ranges and AveragesSite B, Shady Pines
Nitrogen-Nitrate Comparison10/29/08 – 10/30/08 Nitrogen Nitrate (mg/L) Class A Water Standards: N-NO3 less than1.0mg/L Time (Hours)
ShadyPines CushmanRoad Machine detection limit is .008 mg/L Class A Water Standards: SRP less than .1 mg/L
Concentration of Nitrogen and Phosphorous Site A Cushman Road Site B Shady Pines
Bar Graph with Nitrogen and SRP Loads for Sites A & B Nitrogen Level Nitrogen Level SRP Load SRP Load Cushman Road Shady Pines
ML Colonies ML Colonies Filtered Filtered 100 ML 16 100 ML 12 100 ML 10 100 ML 15 10 ML 3 10 ML 0 10 ML 2 10 ML 3 Fecal Colony Counts Site A: Cushman Road Site B: Shady Pines Class A Standard: Fecal Levels should not exceed 200 Colonies Per 100ml
Benthic Macro-Invertebrate Results: Site A-Cushman Road 10/29/08 Ephemeroptera 20.6% Plectoptera 16.1% Trichoptera 45.2% High % Hydropsychidae Diptera: Chironomidae 3.2% Diptera: Other 4% Odonata 2% Megaloptera 4% Coleoptera 3.2% MGBI=3.1 (Excellent) Amphipoda .8% Gastropoda .8%
Plectoptera 9.1% Trichoptera 53% Diptera: Chironomidae 20.3% Diptera: Other 1.4% Megaloptera 2.4% Coleoptera 2% Amphipoda .7% Oligochaeta .7% Benthic Macro-Invertebrate Results: Site B-Shady Pines 10/29/08 Ephemeroptera 10.5% High % Hydropsychidae MGBI=3.8 (Very Good)
Summary of Results • Site A and Site B met the Massachusetts Class A standards. • Site A had slightly higher Nitrate and Specific Conductivity readings which we believe had to do with the rain the days before our site visits washing materials into the river from the golf course. • Both sites had considerably higher numbers of net-spinning caddisflies. These BMI have a higher tolerance to organic pollution. • The pH has returned to normal after the past two years of higher basic levels at both sites.
Presented By: • Michael Ferguson • Daniel Perry • Jimmy Chhoeun • Christina Moses • Chelsea Jewett • Jenna Dean • Patrick Moriarty • Emily Hickey • Abigail Sprague • Griffin Fisher • Jesse Coreas • Amanda Root • Shannon Moore • Steve Retamoza • Joshua Mullaney • Sasha Soto • *Brendan Emanuel *PowerPoint Coordinator