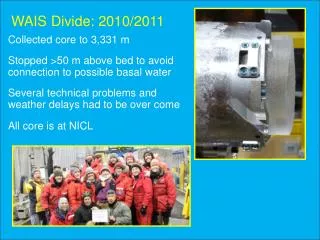
Download
1 / 34
340 likes | 506 Views
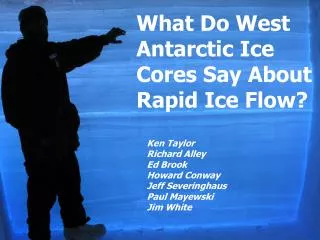
What Do West Antarctic Ice Cores Say About Rapid Ice Flow?. What do Paleoclimate . records tell us about . WAIS stability?. Ken Taylor Richard Alley Ed Brook Howard Conway Jeff Severinghaus Paul Mayewski Jim White. Byrd vs SDM. Warmer Colder. White & Brook. Byrd vs SDM.

E N D
What Do West Antarctic Ice Cores Say About Rapid Ice Flow? What do Paleoclimate . records tell us about . WAIS stability? Ken Taylor Richard Alley Ed Brook Howard Conway Jeff Severinghaus Paul Mayewski Jim White
Byrd vs SDM Warmer Colder White & Brook
Byrd vs SDM Warmer Colder White & Brook
15 ka Byrd vs SDM 22 ka Warmer Colder White & Brook
Byrd vs SDM Warmer Colder White & Brook
kkks • Must be local change at Siple Dome because: • 1) Change does not show up at Byrd • 2) Proxies of distant climate (Dexcess and chemistry) do not show significant changes Gas records Siple Dome Records
kkks Disrupted stratigraphy • Must be local change at Siple Dome because: • 1) Change does not show up at Byrd • 2) Proxies of distant climate (Dexcess and chemistry) do not show significant changes Gas records Siple Dome Records
Regional Climate Change: Would see something at Byrd and in other climate proxies from SDM.
Regional Climate Change: Would see something at Byrd and in other climate proxies from SDM. Mishandling of Core: Gas record/Deuterium record offset is correct
Regional Climate Change: Would see something at Byrd and in other climate proxies from SDM. Mishandling of Core: Gas record/Deuterium record offset is correct Folded Stratigraphy: No suitable ice to fold into record
Regional Climate Change: Would see something at Byrd and in other climate proxies from SDM. Mishandling of Core: Gas record/Deuterium record offset is correct Folded Stratigraphy: No suitable ice to fold into record Ice Flow Overrode Siple Dome Change in record is too abrupt No other ice with right characterisitics
Regional Climate Change: Would see something at Byrd and in other climate proxies from SDM. Mishandling of Core: Gas record/Deuterium record offset is correct Folded Stratigraphy: No suitable ice to fold into record Ice Flow Overrode Siple Dome Change in record is too abrupt
Interpretation 1: Elevation of Siple Dome Changed Lapse Rate 22 ka B.P. 6oC warming, ~200 years 600 m elevation decrease at SDM 15 ka B.P. 3.5oC warming < 1,000? years 350 m elevation decrease at SDM Ice Flow Modeling: Rapid 350 m decrease of Siple Dome at 15 ka (Price et. al., 2007) Atmospheric Modeling: Elevation of ice streams has large influence on temperature at Summit of Siple Dome (Monaghan & Bromwich, 2006)
Interpretation 1: Elevation of Siple Dome Changed Lapse Rate 22 ka B.P. 6oC warming, ~200 years 600 m elevation decrease at SDM 15 ka B.P. 3.5oC warming < 1,000? years 350 m elevation decrease at SDM Ice Flow Modeling: Rapid 350 m decrease of Siple Dome at 15 ka (Price et. al., 2007) Atmospheric Modeling: Elevation of ice streams has large influence on temperature at Summit of Siple Dome (Monaghan & Bromwich, 2006)
Interpretation 2: Elevation of Ice Streams Changed Air Flow Changed Current situation Paleo situation BYRD BYRD SDM SDM Atmospheric Modeling:Elevation of ice streams has large influence on temperature at Summit of Siple Dome (Monaghan & Bromwich, 2006) Ice Sheet Model:Siple Dome was a bump (Dave Pollard)
Some combination of: 1) Changes in SDM surface elevation. (lapse rate) 2) Changes in ice stream elevation. (air flow patterns/katabatic winds) At 15 ka and 22 ka there were large and rapid drawn downs of ice on the Siple Coast.
What caused ice draw down? Sea level rise Sub-ice flood Ice shelf collapse Ice stream internal dynamics
ocean Explaination 16 m Hanebuth 12 m Yokoyama Sea Level The Siple Dome events precede the step increases in sea level. Siple: White et al
What caused ice draw down? Sea level rise Sub-ice flood Ice shelf collapse Ice stream internal dynamics
` Eastern Ross Sea Mosola & Anderson, 2006 Slope Gullies Sub-ice water system
What caused ice draw down? Sea level rise Sub-ice flood Ice shelf collapse Ice stream internal dynamics
Siple Dome • MAP SHOWING • Tdome, SDM, BYRD, Moulton, OCEAM COres Ross Ice Shelf Roosevelt Island http://lima.usgs.gov/access.php BYRD BYRD BYRD
Siple Dome • MAP SHOWING • Tdome, SDM, BYRD, Moulton, OCEAM COres Ross Ice Shelf Roosevelt Island http://lima.usgs.gov/access.php BYRD BYRD BYRD
Ice Shelf Thickness Water Temperature Bathymetry Siple and Shirase Coasts are most vulnerable David Holland
Ice Shelf Thickness Water Temperature Bathymetry Siple and Shirase Coasts are most vulnerable David Holland
Ice Shelf Thickness Water Temperature Bathymetry Siple and Shirase Coasts are most vulnerable David Holland
Ice Shelf Thickness Water Temperature Bathymetry Siple and Shirase Coasts are most vulnerable David Holland
` Eastern Ross Sea Mosola & Anderson, 2006 Iceberg furrows at 650 m No sub-ice shelf deposits Rapid retreat of grounded ice
Siple Dome • MAP SHOWING • Tdome, SDM, BYRD, Moulton, OCEAM COres Ross Ice Shelf Roosevelt Island http://lima.usgs.gov/access.php BYRD BYRD BYRD
What caused ice draw down? Sea level rise Sub-ice flood Ice shelf collapse Ice stream internal dynamics
Siple Coast ice had large and rapid changes at 15 ka and 22 ka Basal flooding Break up of a portion of the Ross Ice Shelf Ice stream internal dynamics
Amanda Mosola & John Anderson Andy Monaghan, Dave Brom
* Ignore this age; the simulation is for 15 ka From dave pollard pollard@essc.psu.edu