Download
1 / 1
10 likes | 231 Views
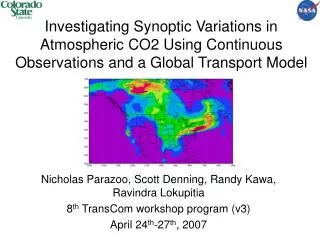
#. #. #. #. Reference Kawa, S. R., D.J. Erickson III, S. Pawson, and Z. Zhu (2004), Global CO2 transport simulations using meteorological data from the NASA data assimilation system, J. Geophys. Res., 109, D18312, doi:10.1029/2004JD004554

E N D
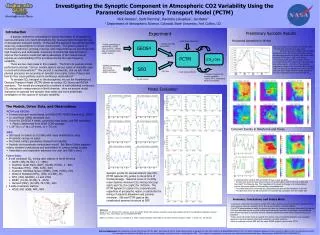
# # # # Reference Kawa, S. R., D.J. Erickson III, S. Pawson, and Z. Zhu (2004), Global CO2 transport simulations using meteorological data from the NASA data assimilation system, J. Geophys. Res., 109, D18312, doi:10.1029/2004JD004554 Sellers, P.J., Mintz, Y., Sud, Y.C. and Dalcher, A. 1986. A simple biosphere model (SiB) for use within general circulation models. J. Atmos. Sci.. 43, 505-531. Investigating the Synoptic Component in Atmospheric CO2 Variability Using the Parameterized Chemistry Transport Model (PCTM) Nick Parazoo1, Scott Denning1, Ravindra Lokupitiya1, Ian Baker1 1 Department of Atmospheric Science, Colorado State University, Fort Collins, CO Introduction Preliminary Synoptic Results A popular method for estimating the global distribution of terrestrial CO2 sources and sinks is to invert atmospheric CO2 measurements through the use of atmospheric transport models. In the past this approach has utilized monthly mean CO2 measurements in remote environments. The global network of monitoring stations is growing, however, and measurements are becoming more high frequency and continental. Inversions of continental data will help to improve the inversion results but taking advantage of the measurements requires an understanding of the processes driving the high-frequency variability. There are two main goals in this research. The first is to evaluate model performance and ask “can our models capture various scales of variability seen in continental observations?” The second is mechanistic, and we ask “what physical processes are occurring on synoptic time scales (order of days) and how do they cause patterns seen in continuous observations?” To simulate CO2 transport in the atmosphere, we use the Parameterized Chemical Transport Model (PCTM) driven by surface CO2 fluxes and GEOS4 reanalysis. The results are compared to a network of well-calibrated continuous CO2 mixing ratio measurements in North America. Here we present model evaluation at seasonal and synoptic time scales and some preliminary investigation of the sources of synoptic variability. Experiment Horizontal Advection in Winter • Fossil fuels, Ocean flux • Winds, CMF, PBL parameters • FVDAS assimilation of radiosondes, aircraft measurements, satellite data (precipitable water, surface winds) GEOS4 • [CO2] anomalies move into SGP on Feb 13, 2003. • The left plot shows the four day event. The fossil fuel (red, middle y-axis) and SiB component (blue, left most y-axis) spike at about the same time as the obs (black, right most y-axis) and total PCTM (green, right most y-axis) • The bottom plots show the evolution of the horizontal SiB and FF components of the CO2 field and surface winds. On Feb 12, the anomalies originate in Houston (FF) and to the NE of Houston (SiB); on Feb 13 they advect north; on Feb 14 they pass over SGP. Fossil fuel and remote biosphere fluxes are significant components of total CO2. PCTM [CO2] Obs • GIMMSg AVHRR NDVI • Biome type • Soil properties • NCEP2 reanalysis SiB3 • CO2 flux • 3 year spinup (00-02) • Compare seasonal and synoptic variability • Use PCTM to understand synoptic processes • 12 year spinup Model Evaluation The Models, Driver Data, and Observations • PCTM and GEOS4: • Forward transport model based on NASA GSFC FVGCM (Kawa et al., 2004) • Lin and Rood (1996) dynamical core • Driven by 3D GEOS 4 winds, convective mass fluxes, and PBL turbulence • Physics determined from NCAR CCM3 package • 1.25° lon x 1° lat x 25 levels, t = 7.5 min Coherent Events in Oklahoma and Texas • SiB3: • SiB based on Sellers et al (1986) with many modifications since • Prognostic canopy air space • Most land surface parameters derived from satellite • Realistic photosynthesis-conductance model. Ball-Berry-Collatz equation relates stomatal conductance and assimilation to surface energy budget • Assimilation and respiration balanced over year (net NEE is zero) • Tower Data: • 8 well calibrated CO2 mixing ratio stations in North America • WLEF, (46N, 90.3W), 11 - 396m • Southern Great Plains (SGP), (36.8N, 97.5W), 2 - 60m • Fraserdale (FRS), (50N, 81W), 40m • Southern Old Black Spruce (SOBS), (54N, 105W), 25m • Western Peatland (WPL), (55N, 112.5W), 9m • AMT, (45N, 68.68W), 11 and 109m • KWKT, (31.3N, 97.3W), 9 - 457m • Harvard (HRV), (42.53N, 72.17W), 29m • 5 eddy-covariance stations • WLEF, SGP, SOBS, WPL, HRV Synoptic events for several stations (top left). PCTM captures CO2 jumps in obs at time of frontal passage. Seasonal cycles of monthly mean daytime minimum CO2 mixing ratio (top right) and CO2 flux (right) for 2003-04. The PCTM appears to capture the seasonal cycle regardless of geographic region, in particular the timing of seasonal drawdown and summer minimum. SiB and PCTM capture the complicated seasonal structure at SGP. • A coherent [CO2] event at SGP and KWKT on July 17 and 18, 2004. • The left plots show the large drop in [CO2] in the observations and PCTM, first at SGP and then KWKT the following day. The magnitude of the event is stronger in the observations but the timing and pattern of the transition is simulated well. • The middle plots show horizontal CO2 distributions just prior to the transitions on the left • The right plots show the SiB component of horizontal CO2 coincident with the middle plot Summary, Conclusions, and Future Work • Continuous continental observations contain information about seasonal and synoptic variability of CO2 • SiB3 captures seasonal variability of CO2 flux at several North American stations • The PCTM demonstrates an ability to capture high and low frequency variations observed at the stations • We have identified several synoptic events where horizontal advection is significant: one wintertime event where fossil fuel is important and one coherent summertime event where biosphere fluxes are important • Future work will involve trying to quantify the relative roles of horizontal advection and ecosystem response to synoptic weather (local and nonlocal) in synoptic variations • Work is underway to drive SiB3 with the same GEOS4 weather used to drive PCTM Acknowledgements: We would like to thank all the tower PI’s for data: Ken Davis at PSU for WLEF, Steven Wofsy at Harvard for HRV, Arlyn Andrews at NOAA/ESRL/GMD for AMT and KWKT, Sebastien Biraud and Marc Fischer at LBNLfor SGP, Douglas Worthy at MSC for Fraserdale and Southern Old Black Spruce, and Larry Flanagan at the University of Lethbridge for WPL. This research is supported by the grants from National Aeronautics and Space Administration (NNG05GD15G & NNG05GF41G )